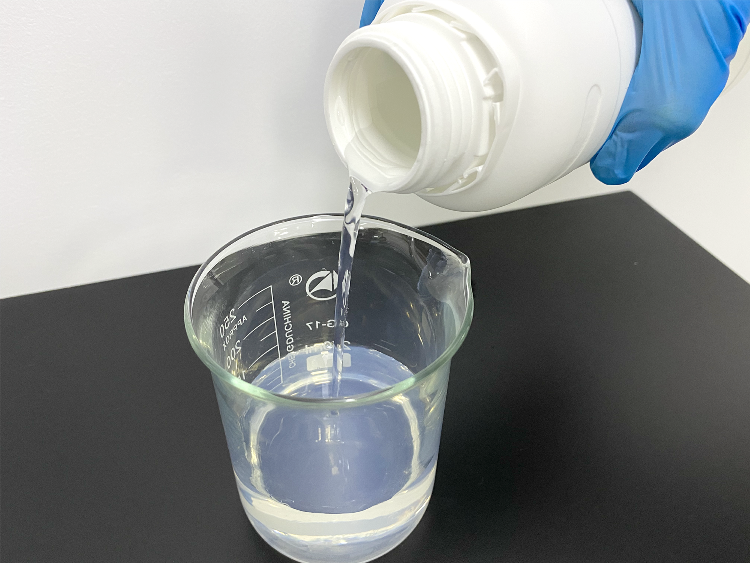
Nanoscale silicon dioxide is extremely versatile. When polishing the semiconductor surface, nanoscale silicon dioxide can be used as an abrasive in addition to being used as a coating material due to excellent surface performance.
The compound improves the reinforcement, shear resistance, thixotropy, etc., and can as a result be widely applied in the fields of steel, plastic, rubber, and solar energy.

Image Credit: Bettersize Instruments Ltd.
Thanks to the recent development in the chemical field, in 1968, Stober discovered that nano-silica spheres, which have a particle size approximately close to monodisperse ones, can be obtained at room temperature. This is achieved by stirring an ammonia mixture in different proportions with tetramethylsilane dispersed in ethanol solution.
In many applications, there is a requirement for nano-silica to be dispersed in a liquid. The measurement of zeta potential is therefore critical, in order to further the understanding of system stability and improve product quality and consistency.
The BeNano 180 Zeta nanoparticle size and zeta potential analyzer from Bettersize was used in this process in order to measure the zeta potential of nano-silica as they are obtained from different batches dispersed in the aqueous environment.
Theory and Instrumentation
The Bettersize BeNano 180 Zeta is fitted with a solid-state laser, which has a wavelength of 671 nm and a light source power of 50 mW. The charged particles are driven to electrophoresis by applying an electric field to the sample.
The frequency of the scattered light shift from the origin is due to the electrophoretic movement of the particles at the point at which the laser irradiates the sample. An APD (avalanche photodiode detector) is used to gather scattered light signals at 12°.
By use of phase analysis light scattering (PALS) technology, the zeta potential of samples even with low electrophoretic mobility can be detected by the BeNano 180 Zeta.
Experiment
The zeta potential of four nano-silica slurry samples was measured in two states – both at its original concentration (with a solid content of 10%) and at a state of 30-times dilution in water.
To ensure the repeatability of the result and obtain the standard deviation thereof, each sample was measured a minimum of three times.
Results and Discussion
The zeta potentials of four nano-scaled silica suspensions are obtained by use of PALS technology. The phase plot of each measurement is depicted in Figures 1-4, the slope of which correlates with the frequency shift caused by electrophoresis. Each phase plot shows a clear slope and demonstrates a good signal-to-noise ratio, as is evidenced by the figures.

Figure 1. The phase plot and zeta potential trend of sample 1# with original concentration (left) and diluted by 30 times (right). Image Credit: Bettersize Instruments Ltd.

Figure 2. The phase plot and zeta potential trend of sample 2# with original concentration (left) and diluted by 30 times (right). Image Credit: Bettersize Instruments Ltd.

Figure 3. The phase plot and zeta potential trend of sample 3# with original concentration (left) and diluted by 30 times (right). Image Credit: Bettersize Instruments Ltd.

Figure 4. The phase plot and zeta potential trend of sample 4# with original concentration (left) and diluted by 30 times (right). Image Credit: Bettersize Instruments Ltd.
As is illustrated, the zeta potentials are negative, which displays a negative charge on the particle surface. Excellent result reproducibility is demonstrated by the consistent zeta potential trends as well as relatively small standard deviations.
The samples are less likely to form aggregates, given that the zeta potentials of all samples are high (>30 mV). It can therefore be concluded that sample 1# and sample 2# have the highest zeta potentials, followed by sample 3#, and the lowest sample 4#.
It appears clear that samples 1# and 2# are the most stable among the four silica suspensions. Furthermore, after having been diluted 30 times, samples 2# and 3# have much greater absolute values of zeta potentials, which indicates better stabilities than those of stock solutions.
Table 1. The zeta potential results of silica samples. Source: Bettersize Instruments Ltd.
| Sample |
Zeta potential
(stock solution) (mV) |
Zeta potential
(30 times dilution) (mV) |
| 1# |
-55.08±1.18 |
-52.48±0.56 |
| 2# |
-43.90±1.2 |
-50.85±0.64 |
| 3# |
-35.98±1.07 |
-45.22±0.50 |
| 4# |
-33.40±0.77 |
-37.52±0.56 |
Conclusions
The BeNano 180 Zeta was used to take Zeta potential measurements of four nano-silica suspensions, both with high concentration and 30-times dilution by pure water.
Good repeatability is shown in the results, which allows for stability comparison between different formulations or batches to allow the controlling and monitoring of product quality.

This information has been sourced, reviewed and adapted from materials provided by Bettersize Instruments Ltd.
For more information on this source, please visit Bettersize Instruments Ltd.
