Cheese plants rely heavily on the in-depth analysis of fat, moisture, salt, protein and pH. The producer is able to obtain significant savings and ensure product quality and consistency by accurately controlling these constituents.
Therefore, process optimization is facilitated by fast results, which allows producers to avoid costly mistakes and potential penalties.
Cheese analysis is particularly suited to the technique of Near Infrared Spectroscopy (NIR, but it must be acknowledged that, due to past instrument limitations, users have not been able to reap the full benefits of the technology.
Stringent sample presentation requirements, such as the use of glass samples which had to be properly filled and cleaned thoroughly, naturally rendered analysis onerous, error-prone and laborious.
DA 7250 NIR Analyzer
Designed for use in the food industry, the PerkinElmer DA 7250 is a proven NIR instrument that uses novel diode array technology in order to perform a multi-component analysis in just 6 seconds.
Open cups or disposable petri dishes allow measurements to be performed without the risk of unsanitary vessels contaminating results. As the DA 7250 instrument is available in a sanitary design version and is IP 65 rated, it can be used both in the lab and in the production environment.
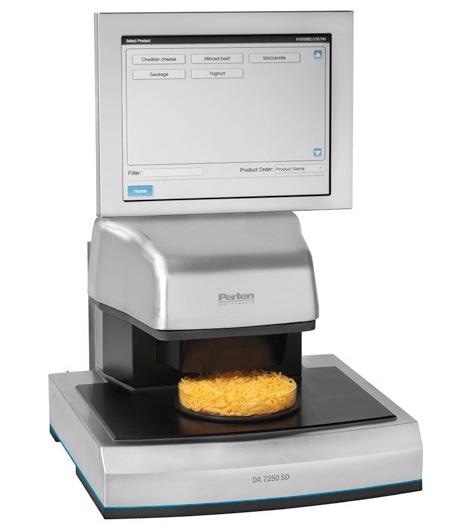
Image Credit: PerkinElmer
Method
Approximately 10,000 different cheese samples were collected from processing plants in both North America and Europe, which were subsequently combined to serve as a NIR calibration set.
Various processed and finished cheese types were included in the calibration set. Open faced sampling dishes and disposable petri dishes were used to collect spectral data for each sample on the DA 7250 instruments.
The purpose of creating calibration models was purely to model the relationships between the instrument's NIR spectra and reference chemistry results using Perten Hongis Regression (otherwise known as HR) and Artificial Neural Network Regression (known as ANN).
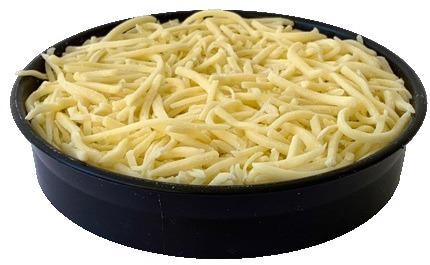
Image Credit: PerkinElmer
Results and Discussion
Statistics of developed calibrations are summarized in the table below. N denotes the number of calibration samples, R is the symbol representing correlation strength, and range the variability of each parameter. Figures 1, 2 and 3 display the reference vs NIR calibration graphs.
Table 1. Summary of developed calibrations. Source: PerkinElmer
| Parameter |
N |
Range |
R |
| Moisture % |
9500+ |
8.2 – 77.7 |
0.99 |
| Fat % asis |
5000+ |
10.0 – 41.0 |
0.98 |
| Salt % asis |
5500+ |
0.04 – 5.7 |
0.95 |
| Protein % asis |
800+ |
6.5 – 29.9 |
0.99 |
| pH |
900+ |
4.6 - 6.2 |
0.82 |
The difference between the reference method and the DA 7250 is the same magnitude as the value difference between two reference labs.
To summarize, it is evident that cheese can be analyzed for moisture, salt, fat, protein and pH by the DA 7250 in just 6 seconds.
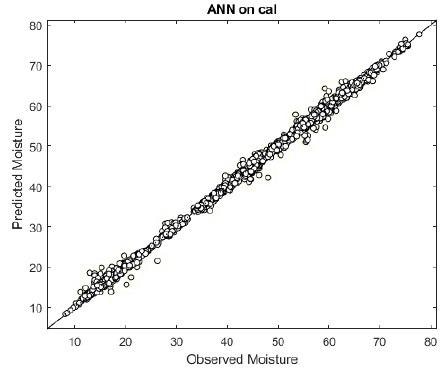
Figure 1. Moisture: Proper moisture levels affect the profitability of the plant as well as the quality of the product. The DA 7250 ANN calibration is robust and covers a large moisture range. Image Credit: PerkinElmer
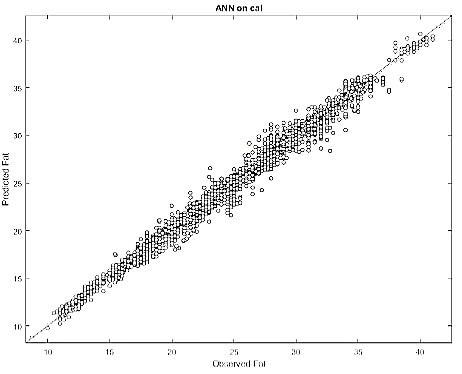
Figure 2. Fat: Fat is accurately and readily measured across a wide range of values. With the DA 7250, the fat content can be monitored in production and ensure produced cheese is within specification. Image Credit: PerkinElmer

Figure 3. Salt: Salt affects taste and performance in different products. The DA 7250 ANN salt calibration is robust and covers large variability in range and included products. Image Credit: PerkinElmer

This information has been sourced, reviewed and adapted from materials provided by PerkinElmer.
For more information on this source, please visit PerkinElmer.