It is important to understand the characteristics of both AC and DC measurements, as both can probe the cure state of thermosets and composites, so it is vital to have a clear outline of the benefits and drawbacks of each when deciding which to use.
Also known as Dielectric Analysis (DEA), dielectric cure monitoring is an AC technique that uses a sinusoidal signal of a chosen frequency and amplitude to excite a sensor, along with a DC bias of zero volts. DC resistance cure monitoring, by contrast, relies upon a constant bias voltage to generate this same excitation. These two types of signals are demonstrated in Figure 1.
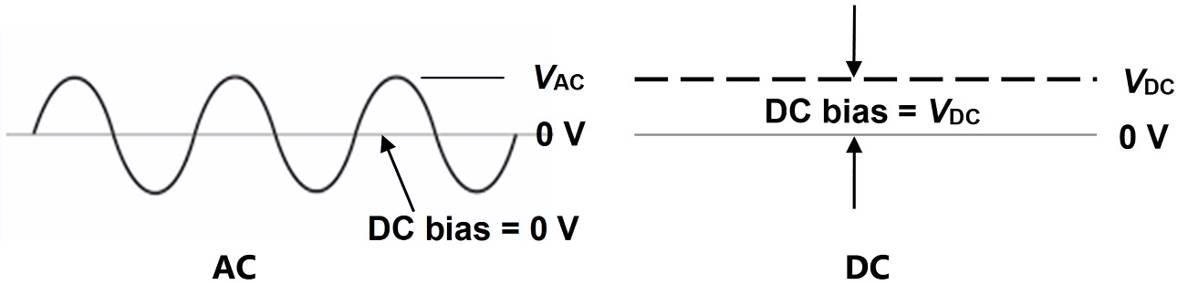
Figure 1. AC and DC excitations used for cure monitoring. Image Credit: Lambient Technologies
The basic AC electrical model of a dielectric Material Under Test (MUT) (which consists of a bulk resistance and capacitance) is shown in Figures 2.a. and 2.b., both in series with boundary layer capacitances generated by electrode polarization.
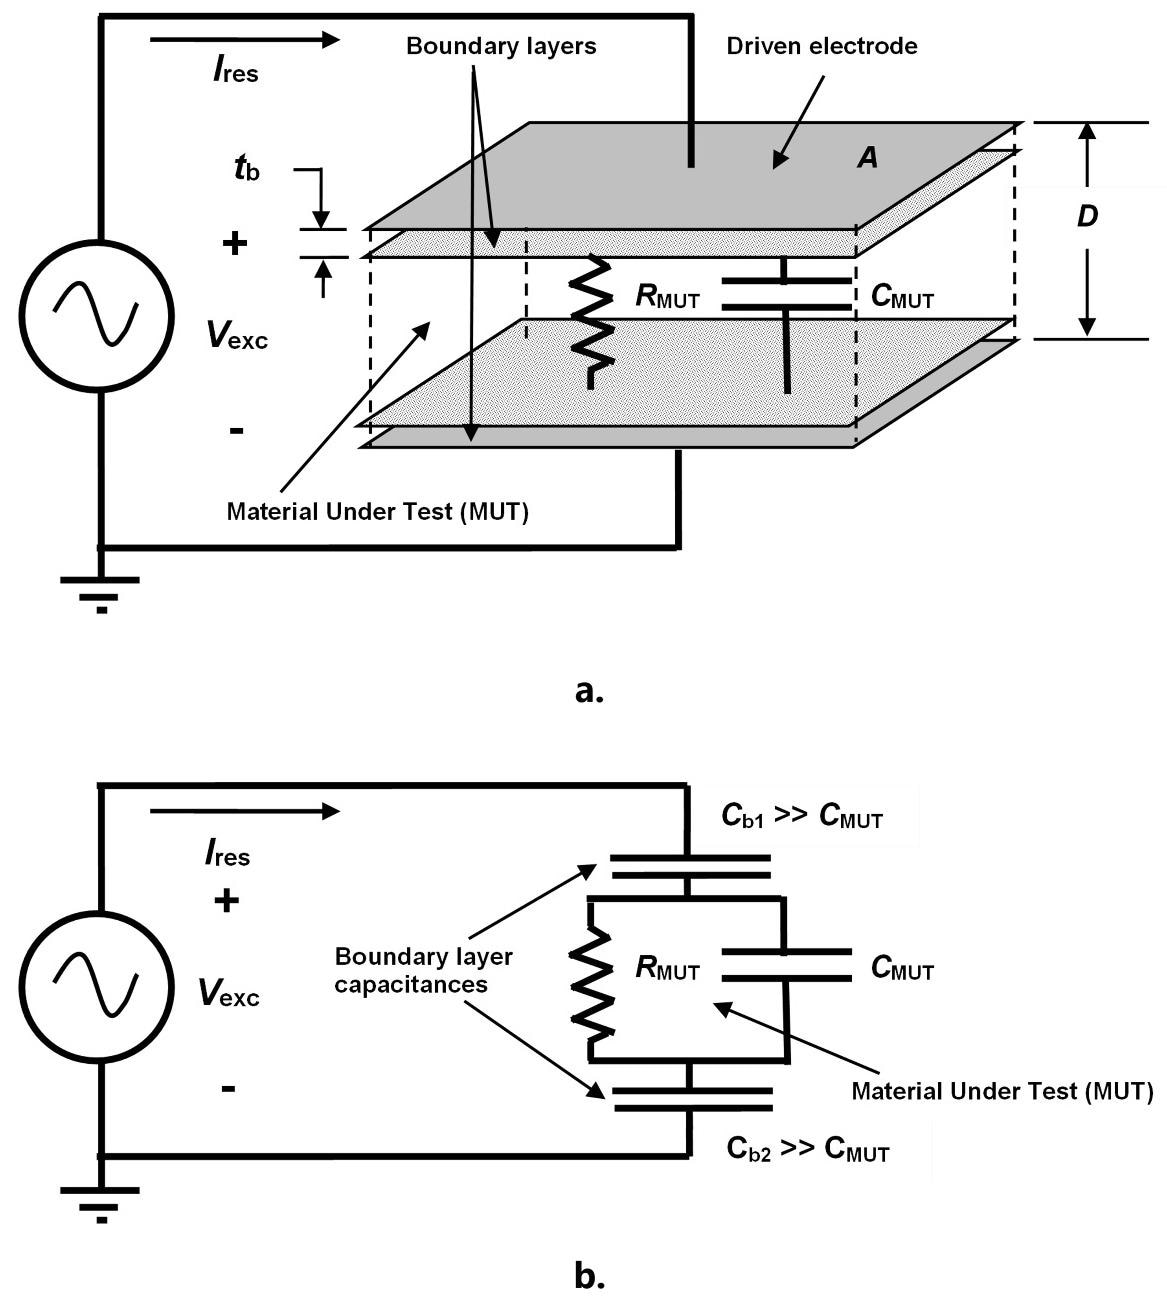
Figure 2. Physical (a.) and circuit (b.) models of thermoset resin for AC measurements. Image Credit: Lambient Technologies
The bulk resistance is scaled by a sensor’s cell constant and facilitates the calculation of the material property of resistivity. Despite the fact that the resistance or DC resistivity of thermosets is commonly thought to be the same as frequency independent resistivity (or resistance), in reality, the two differ because resins can behave as electrolytes rather than passive electronic components.
As a result, it is proposed that these properties should be redefined for materials subject to electrochemistry:
- DC resistivity (ρDC) – Thermoset resistivity measured at f = 0 Hz with a DC bias. This can be called DC ion viscosity (IVDC) for convenience.
- Frequency independent resistivity (ρAC) – Thermoset resistivity that is constant or nearly constant across a range of AC frequencies and measured without a DC bias. This can also be called ion viscosity (IV) or AC ion viscosity (IVAC) for convenience.
PR 520N1 is the name given to a pre-mixed epoxy system engineered for resin transfer molding (RTM). PR 520N is a thick off-white paste at room temperature, and full cure is specified by the manufacturer after two hours at 179 °C. PR 520N was applied to a Mini-Varicon2 sensor for AC and DC tests, as shown in Figure 3, and the sample was heated to 180 °C.
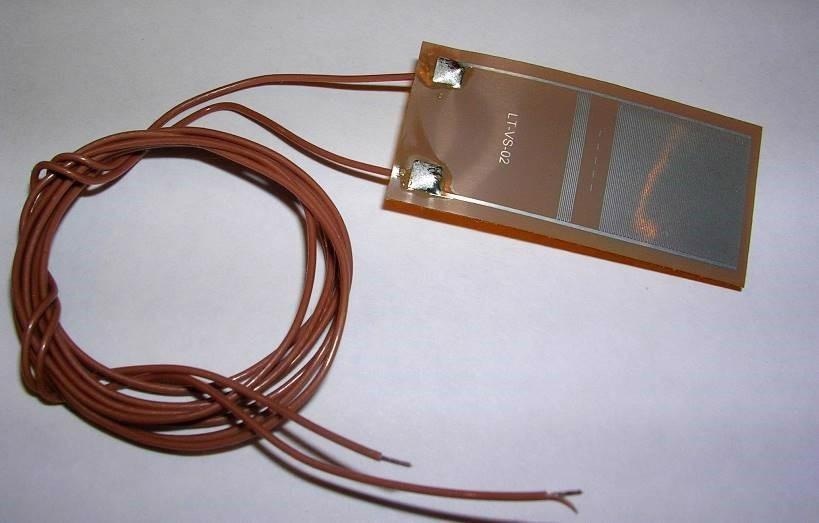
Figure 3. Mini-Varicon dielectric cure sensor. Image Credit: Lambient Technologies
The LT-451 Dielectric Cure Monitor3 and a “floating electrode” circuit,4 widely used for dielectric cure monitoring, were used to make AC measurements. The LT-440 Dielectric Channel,5 using the circuit of Figure 4, with load resistance RL determining the current through the sample, was used to make DC measurements.
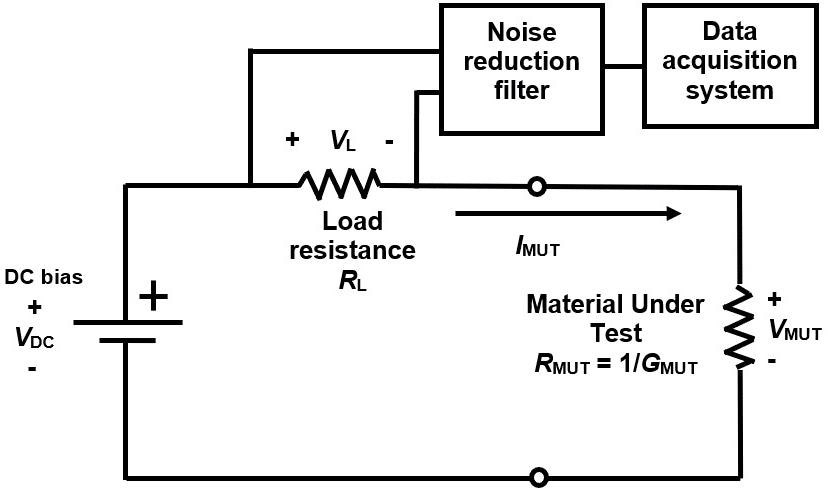
Figure 4. Circuit for DC resistance cure monitoring. Image Credit: Lambient Technologies
AC and DC data from PR 520N cured isothermally at 180 °C on Mini-Varicon sensors is displayed and compared in Figure 5. An optimum excitation frequency that accurately follows the entire cure was identified as 10 Hz by preliminary testing.
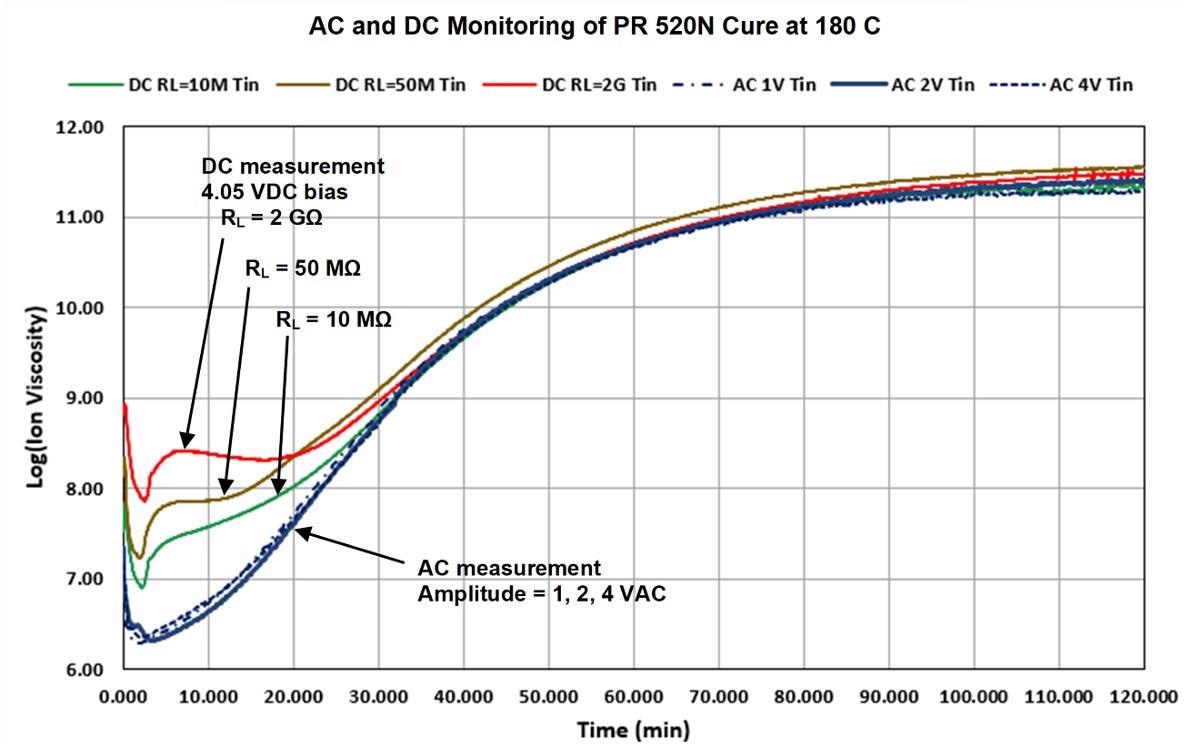
Figure 5. AC (10 Hz) and DC ion viscosity of PR 520N cure. Image Credit: Lambient Technologies
The 10 Hz AC ion viscosity curve of Figure 5 approaches a constant value at approximately 120 minutes, which indicates that the reaction is slowing and the cure is ending. This behavior is in accordance with the manufacturer’s specifications of full cure after two hours at the temperature of 179 °C.
The AC ion viscosity curve did not change in subsequent tests over a range of excitation voltages (1, 2 or 4 VAC), which indicates that the AC ion viscosity operates independently of the details of the measurement circuit.
There were, however, significant deviations in DC ion viscosity from AC results during early to mid-cure. Moreover, DC ion viscosity varied in conjunction with the load resistance (10 MΩ, 50 MΩ or 2 GΩ) and the resulting current level.
As demonstrated in Figure 6.a., the discrepancies between AC and DC data can be modeled with a DC electrochemical resistance in parallel with the boundary layer capacitance. This additional resistance does not affect AC measurements because the boundary layer capacitance transports the AC current around the DC electrochemical resistance.
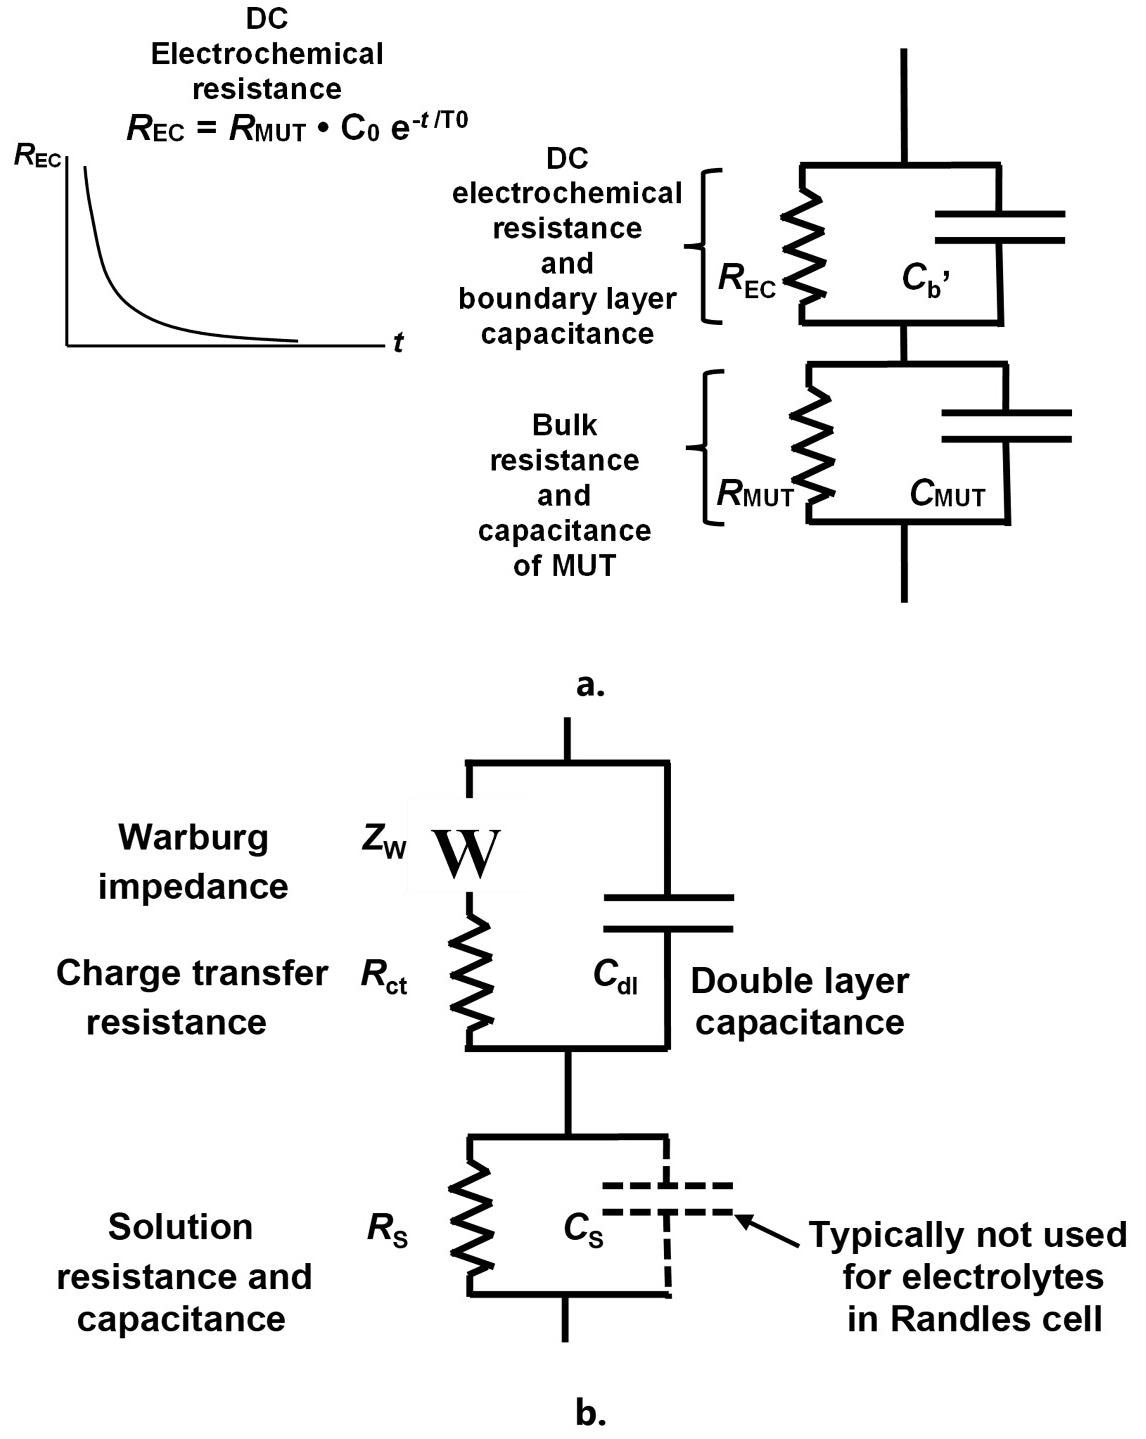
Figure 6. Revised model of a thermoset resin (a.) and Randles cell (b.). Image Credit: Lambient Technologies
Proportional to monomer concentration, the DC electrochemical resistance decreases exponentially with time as monomers are consumed, as expected from a first-order reaction. DC measurements consequently converge toward AC results at the end of cure, which is when the resin is highly resistive and does not possess significant electrochemistry.
Analogous to the Randles cell shown in Figure 6.b., the revised thermoset model is used for the study of electrolytes within electrochemical impedance spectroscopy (EIS).
A resin may be treated as a highly resistive electrolyte during early cure, and its boundary layer capacitance has long been understood to be an electrolytic double layer capacitance.6 Indeed, the resin’s DC electrochemical resistance similarly originates in ionic diffusion or reactions at the electrolyte-electrode interface.
Table 1 depicts the correspondences between the Randles cell and elements of the revised thermoset model.
Table 1. Correspondence between thermoset and Randles cell models. Source: Lambient Technologies
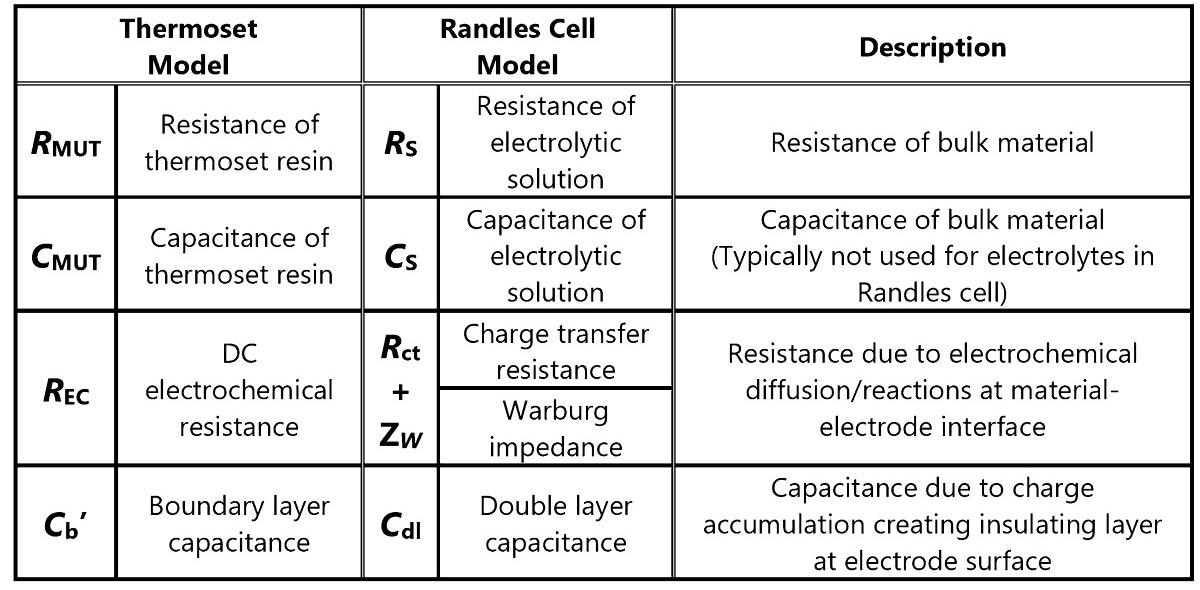
The diffusion of electrons in both directions creates charge transfer resistance between the electrolyte and electrode. The diffusion of reactants to the electrode surface control faradic reactions at the electrolyte-electrode interface: this diffusional resistance is termed the Warburg impedance.
Applied voltage or current can cause these Randles cell resistances to vary - just as observed with the DC ion viscosity of PR 520N.
The humps between 5 and 15 minutes are transients caused by a current through the DC electrochemical resistance as it charges the bulk capacitance for the DC ion viscosity of Figure 5.e. This transient response can be described, by basic circuit theory, with a time constant, an exponential delay and a simple resistor-capacitor (RC) circuit.
Accounting for only two additional phenomena, the revised thermoset model implies that DC ion viscosity may be derived from AC ion viscosity by:
- A transient at the beginning of cure, paired with
- Consumption of monomers during cure
The following expression relates AC and DC ion viscosity by incorporating these two behaviors for the isothermal case:
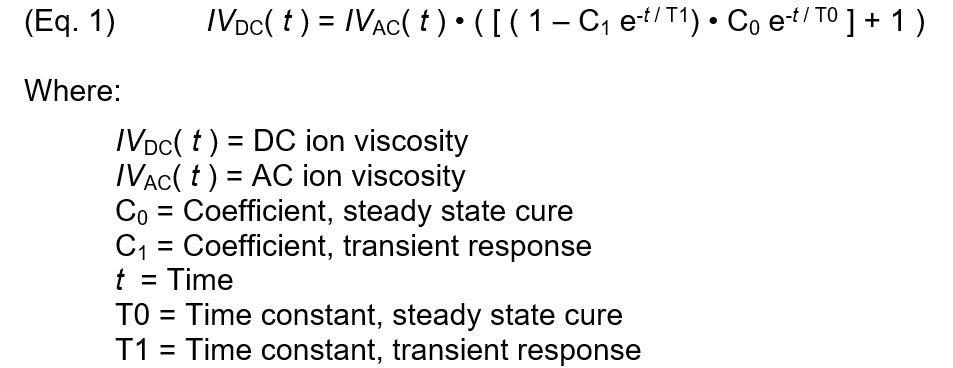
Figure 7 depicts a plotted model of Equation 1 against actual PR 520N DC ion viscosity. DC ion viscosity decreased for the first two minutes due to the initial heating of the material, so the data obtained during this period was not included as cure. The revised thermoset model can reproduce DC ion viscosity from AC ion viscosity over the entire cure with a proper selection of parameters.
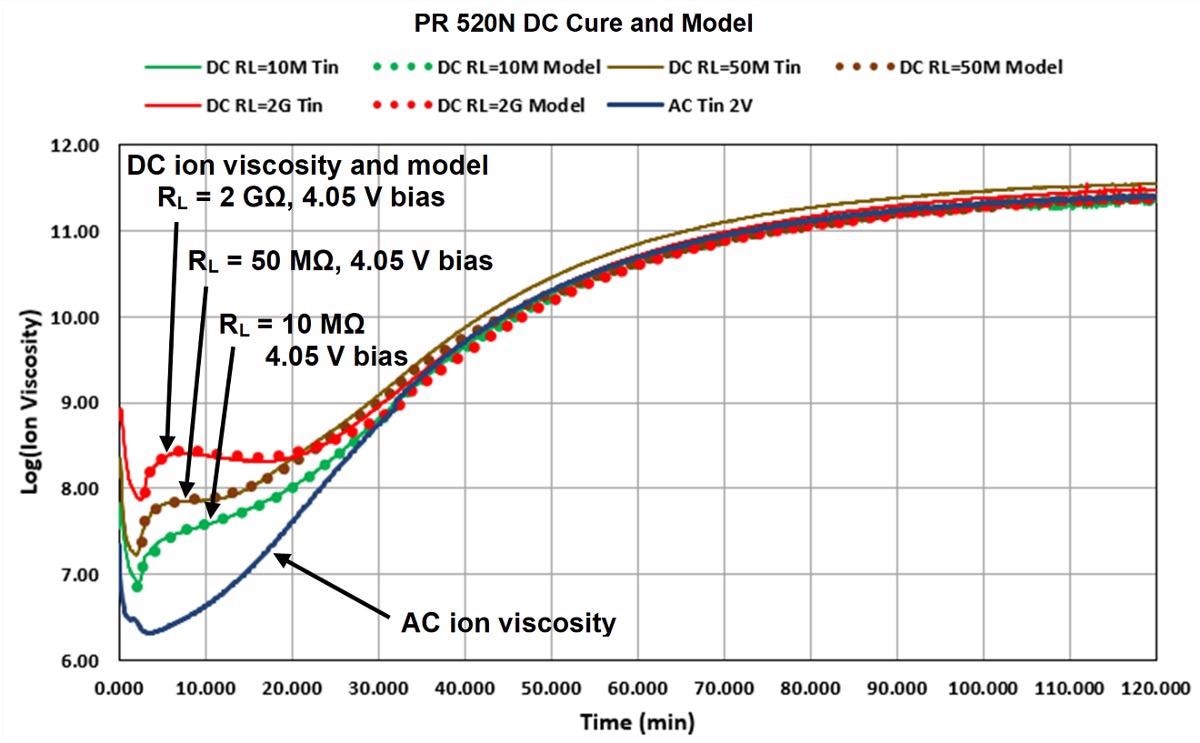
Figure 7. Model fit to DC cure data of PR 520N, 180 ºC isothermal cure. Image Credit: Lambient Technologies
Having established the key differences between AC and DC measurements, guidance may now be provided for their use:
- The entire cure of most resins can be accurately followed by AC measurements at an optimum frequency.
- During early to mid-cure, DC measurements have uncertain accuracy and are most accurate during mid- to end of cure.
- When AC measurements require unfeasibly low frequencies and long measurement times for highly resistive materials like silicones, DC measurements can be useful.
References
- Cycom PR 520N RTM manufactured by Solvay, Brussels, Belgium
- Mini-Varicon sensor, manufactured by Lambient Technologies, Cambridge, MA USA. https://lambient.com
- LT-451 Dielectric Cure Monitor, manufactured by Lambient Technologies, Cambridge, MA USA
- Application Note AN 3.25, “Dielectric Measurement Techniques,” Lambient Technologies, Cambridge, MA USA
- LT-440 Dielectric Channel, manufactured by Lambient Technologies, Lambient Technologies, Cambridge, MA USA
- D.R. Day, J. Lewis, H.L Lee, S.D. Senturia, “The Role of Boundary Layer Capacitance at Blocking Electrodes in the Interpretation of Dielectric Cure Data in Adhesives,” Journal of Adhesion, 1985, vol.18, p.73.

This information has been sourced, reviewed and adapted from materials provided by Lambient Technologies.
For more information on this source, please visit Lambient Technologies .