To capture data across erratic or inclined sample surfaces while maintaining sample focus, the vertical position of the microscope stage is modified while using the Raman imaging technique known as terrain mapping.
A narrowly concentrated laser point offers a higher laser power density, which increases the analysis volume’s Raman intensity. Good spatial resolution and Raman intensity are ensured by maintaining a narrow laser focus while traveling across a sample.
Visualizing the spatial distribution of a component or components throughout a sample region is one benefit of Raman imaging.
Raman intensity interpretation is made more challenging by variations in sample focus during imaging since it is difficult to distinguish between changes in intensities brought on by variations in sample focus and those produced by changes in the sample itself.
The quality of the Raman spectra and the ability to use the spectral data as a spatial or spectral identification tool can also be impacted by a considerable loss in Raman intensity and spatial resolution.
The focus is maintained when traveling across flat samples, making them the most suitable for Raman imaging. However, producing flat samples is not always feasible or practicable. (i.e., the creation of a microscopically flat surface may be hindered by the physical characteristics of specific materials).
When attempting to create a smooth surface, some samples, such as coatings, can be harmed or eliminated. In other situations, the sample cannot be modified since it must be preserved in its original form.
Even if there are no limitations on what may be done to a sample, the procedures needed to create microscopically flat samples are occasionally too laborious and time-consuming to be valid. Therefore, it is essential to have a method for imaging rough, sloping, or uneven samples utilizing techniques like terrain mapping.
Figure 1 shows the result of terrain mapping, which illustrates a curved tablet with letters stamped onto its surface. When comparing the visual mosaic pictures, it is easy to observe that terrain mapping maintains sample focus across the sample surface.
The Raman MCR (multivariate curve resolution) picture is impacted by maintaining a strong sample focus; the image captured via terrain mapping exhibits substantially greater delineation of the sample components. Without terrain mapping, the component particles in the picture are less distinct, and some are even completely absent.

Figure 1. Raman imaging of a tablet surface with and without terrain mapping. A) Multivariate curve resolution (MCR) Raman image collected with terrain mapping. B) MCR Raman image collected without terrain mapping. C) Composite visual mosaic image using terrain mapping. D) Visual mosaic without terrain mapping. Image Credit: Thermo Fisher Scientific – Materials & Structural Analysis
This article will demonstrate the use of terrain mapping to examine thin films (patinas) created on irregular copper surfaces. It is possible to purposely make patinas to give items the impression of age or to create textures or colors, but they can also develop naturally when exposed to environmental factors like air, acid rain, salt water, etc.
Copper patinas are created when the exposed surface oxidizes, but how they develop determines the precise composition of the compounds created. Different copper oxides (Cu2O and CuO), as well as hydroxide, carbonate, chloride, nitrate, and sulfate, can all provide a clue as to the patinas’ origin and the process by which they were formed.
Experimental
One-cent coins (pennies) from the US were the specimens utilized in this article, as depicted in Figure 2. A readily noticeable example of how terrain mapping can be employed with uneven surfaces is the raised numbers and characters that are produced during the minting process that is visible above the surface of the penny.

Figure 2. United States one-cent coin (penny). Image Credit: Thermo Fisher Scientific – Materials & Structural Analysis
The zinc inside the penny currently in circulation is covered with a copper coating. Four pennies were purposefully subjected to a variety of environments to produce various patinas. Even though these patinas were intentionally made, they contain elements that are also present in patinas that form naturally.
Using a Thermo Scientific™ DXR3xi Raman Imaging Microscope and Thermo Scientific OMNICxi Software’s terrain mapping capability, portions of the pennies were scanned. the team decided to utilize a 455 nm laser since its spectra had the optimum balance of minimum fluorescence artifacts and strong Raman intensity.
Gathering viewable mosaic photos of the sample at various focus points, ranging from the lowest to highest points in the region of interest, is the first stage in terrain mapping. The pixels from the numerous out-of-focus sites are then merged to generate a composite visual image that includes all the in-focus points.
This data is then utilized to construct a terrain mosaic. To guarantee that the sample surface is in focus when collecting the Raman spectra, the vertical stage locations of the in-focus points are then utilized.
The focus location data is stored to build a 3D image of the sample surface and overlay the Raman imaging data on top of it.
Results
Table 1 lists the criteria for gathering the terrain mosaics as well as the circumstances utilized to produce the patinas. The focal range, which was calculated using the highest and lowest points of the sample in the region of interest, is the total vertical distance that the stage was moved from the highest to the lowest focus point.
Table 1. Sample treatment conditions and terrain mapping details. Source: Thermo Fisher Scientific – Materials & Structural Analysis
| Penny |
Conditions |
Focal range (µm) |
Interval (µm) |
Objective |
Figure |
| 1 |
Gentle heating (150 °C, 30 min) |
150 |
3 |
20x |
3 |
| 2 |
Heating to 250 °C |
95 |
0.7 |
50x |
6 |
| 3 |
Ammonia vapor (room temperature) |
74 |
0.7 |
50x |
8 |
| 4 |
Exposure to carbon dioxide in air |
31 |
3 |
20x |
10 |
The interval, which is dependent on the depth of field of the objective, shows the increments in which the stage location was shifted over the focal range. The terrain mosaics are depicted in both 2D and 3D in the figures.
Table 2 gives information on the Raman data collecting settings as well as the discovered components. The step size is the horizontal spacing between points across the sample surface and was selected based on the objective used and the size of the area analyzed.
Table 2. Raman imaging parameters and components identified. Source: Thermo Fisher Scientific – Materials & Structural Analysis
| Penny |
Area imaged (µm) |
Step size (µm) |
Number of spectra |
Components |
Figure |
| 1 |
3475 × 1535 |
10 |
53592 |
Cu2O |
4 |
| 2 |
940 × 630 |
5 |
24003 |
Cu2O, CuO |
7 |
| 3 |
930 × 1040 |
5 |
39083 |
Cu2O, Cu(OH)2 |
9 |
| 4 |
1515 × 1580 |
10 |
24168 |
Cu2O, CuCO3(OH)2 |
11 |
The 3D representations of the terrain mosaics in the pictures are overlaid with the Raman images created from the spectral data.
Penny 1 was slowly heated until a small change in the hue of the surface was seen. As seen in Figure 3, this penny has a raised region with the year it was coined and a little crooked surface. To more clearly display the topographical characteristics of the sample, the z-axis in the figure has been extended.

Figure 3. Visible terrain mosaic from Penny 1. A) 2D image. B) 3D image with the z-axis expanded to demonstrate surface topography. Image Credit: Thermo Fisher Scientific – Materials & Structural Analysis
The peak area intensity of the Cu2O-related 645 cm–1 peak, which was identified throughout the whole surface but with varied intensity, was used to create the Raman picture seen in Figure 4. Compared to the lighter blue and white portions, the darker blue areas in the image show a larger concentration on the tops of the numerals.
The thin oxide layer is what permits Raman’s vizulization of the surface because the copper metal itself is not Raman active.

Figure 4. Raman peak area intensity image from Penny 1 based on the Cu2O peak at 645 cm–1. Image Credit: Thermo Fisher Scientific – Materials & Structural Analysis
Terrain mapping has several advantages, as seen in Figure 5. It is evident that terrain mapping (Figure 5A 1–4) yields much better results than employing a single focus point for the collection of both the visual (Figure 5B 1–3) and Raman (Figure 5B 4) pictures.
Both the visual detail and the Raman peak intensity are significantly reduced. Both the visual and Raman measurements are obviously impacted by the elevated numbers and tilt of the sample seen in Figures 3 and 4.
At greater magnifications - which were used to capture the images in Figure 5 - the influence of sample topography should be considerably more noticeable.

Figure 5. Comparing results collected with terrain mapping (A1–A4) and those collected at a single focal point without terrain mapping (B1-B4). A1–A3 and B1–B3 are visual mosaic images. A4 and B4 are Raman images based on the peak area of Cu2O at 645 cm–1, where the darker blue color indicates higher peak intensity and white represents lower peak intensity. Image Credit: Thermo Fisher Scientific – Materials & Structural Analysis
Another byproduct of copper oxidation, in addition to Cu2O, is cupric oxide (CuO). Higher temperature heating of Penny 2 resulted in a deeper hue corresponding with the production of CuO. The terrain mosaic of the letter “L” in the word “liberty” on Penny 2 is seen in Figure 6. Both Cu2O and CuO were found in this sample, according to the Raman analysis.

Figure 6. Visible terrain mosaic from Penny 2. A) 2D image. B) 3D image with the z-axis expanded to demonstrate surface topography. Image Credit: Thermo Fisher Scientific – Materials & Structural Analysis
The Raman image in Figure 7 was created using a multivariate curve resolution (MCR) analysis of the Raman spectra, which allows for the identification of various components without needing to understand their spectral characteristics in advance. There were also a few spots of carbon that could have come from the organic material on the penny decaying during heat treatment.

Figure 7. Raman MCR image from Penny 2 with Cu2O shown in blue and CuO shown in green. Image Credit: Thermo Fisher Scientific – Materials & Structural Analysis
Blue copper (II) hydroxide (Cu(OH)2) can emerge on copper or bronze surfaces when they come into contact with basic liquids. Amphoteric copper hydroxide can dissolve in some aqueous solutions. To create the Cu(OH)2 patina on Penny 3, aqueous ammonia fumes were used as the exposure medium.
The engraved “0” on the coin is depicted in a terrain mosaic in Figure 8; Raman’s investigation revealed the presence of Cu(OH)2 on the copper surface.

Figure 8. Visible terrain mosaic from Penny 3. A) 2D image. B) 3D image with the z-axis expanded to demonstrate surface topography. Image Credit: Thermo Fisher Scientific – Materials & Structural Analysis
Figure 9 shows an MCR Raman picture with Cu(OH)2 concentrated in the blue areas, Cu2O present in the orange areas, and a combination of both components in the purple areas.
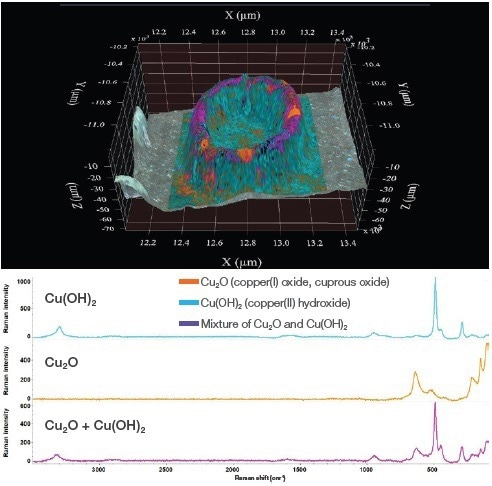
Figure 9. Raman MCR image from Penny 3 with Cu2O shown in orange and Cu(OH)2 shown in cyan. Mixtures of both are indicated in purple. Image Credit: Thermo Fisher Scientific – Materials & Structural Analysis
Copper patinas can include copper hydroxide, although it is more likely to show up if the patina develops slowly over time. Copper hydroxides that include carbonate are created when carbon dioxide from the air is present. Minerals like azurite (Cu3(CO3)2(OH)2) and malachite (Cu2CO3(OH)2) are created as a result of these reactions.
The letter “A” engraved on Penny 4 is depicted in Figure 10 as a terrain mosaic, and the MCR Raman picture is shown in Figure 11. Around the letter “A’s” base, Cu2CO3(OH)2 was identified, whilst Cu2O was mostly located on top of the letter.

Figure 10. Visible terrain mosaic from Penny 4. A) 2D image. B) 3D image with the z-axis expanded to demonstrate surface topography. Image Credit: Thermo Fisher Scientific – Materials & Structural Analysis

Figure 11. Raman MCR image from Penny 4. Cu2O is shown in red and Cu2CO3(OH)2 is shown in blue. A) Raman data superimposed on the 3D terrain mosaic. B) Raman data superimposed on the 2D terrain mosaic. Image Credit: Thermo Fisher Scientific – Materials & Structural Analysis
Additionally, there were a few tiny spots (seen in the photograph as green regions) that appeared to be some sort of azo dye or pigment. While note anticipated, it is interesting to note that this dye or pigment was found on the penny’s surface.
Conclusions
For a variety of reasons, flattening samples for Raman analysis is not always desired, practicable, or viable, hence it is critical to have a technique to maintain sample focus during Raman imaging of uneven surfaces.
Both the spatial resolution and the Raman intensity are preserved in this manner. Since copper pennies feature surface structures created during the minting process, the application of terrain mapping was demonstrated by the examination of patinas on copper pennies.
Surface oxidation was used in a variety of settings to create copper patinas. The concepts discussed in this article can be expanded upon to explore a broad range of thin films on a number of materials.
Applications for terrain mapping might range from examining the artwork and culturally significant items to examining metal corrosion and thin layers on uneven surfaces.

This information has been sourced, reviewed and adapted from materials provided by Thermo Fisher Scientific – Materials & Structural Analysis.
For more information on this source, please visit Thermo Fisher Scientific – Materials & Structural Analysis.