Sponsored by PerkinElmerReviewed by Olivia FrostSep 15 2022
The metabolic process by which organisms, particularly yeasts, produce ethanol and CO2 from sugars (e.g., glucose, fructose, & sucrose) under anaerobic conditions is called alcohol fermentation. Fermented foods are popular and well-liked for their complex flavor profile and positive health effects - a result of the combination of yeast metabolome with feedstock biomass.
Many foods, particularly unpasteurized foods and probiotics, may continue to ferment even once they are bottled and packaged, which therefore increases the alcohol content over time.
Beverages in the United States are considered non-alcoholic if they possess an ethanol concentration of ≤ 0.5% vol/vol.1 However, this value is set at ≤ 1.1%2 in Canada.
Beverages exceeding 1.2% vol/vol alcohol are labeled differently from those beneath this value3 in the European Union, while in the Muslim world, naturally fermented foods ≤ 1.0% ethanol can be considered Halal.4 As the sale of alcoholic beverages is regulated and taxed differently than non-alcoholic beverages, these thresholds are essential. Other food products, such as sauces and fruits, may contain alcohol from natural fermentation.
For the rapid, sensitive quantification of ethanol in food, the PerkinElmer GC 2400™ System with flame ionization detector and PerkinElmer HS 2400™ Headspace Sampler (HS-GC/FID) is an ideal workflow solution.
In advance of injection, the reliable HS 2400 HS-GC/FID is capable of queuing up samples, while ethanol can be accurately quantitated over a wide range of concentrations thanks to the precise pneumatics of the HS 2400 and GC 2400. Low noise thresholds are offered by the Elite-BAC1 Advantage column for sensitive, robust quantitation in complex food matrices.
The tried-and-true, high-throughput ethanol in food method first developed at PerkinElmer5 is expanded upon in this analysis, analyzing alcohol content in various commercially available beverages and foods, including fruit juice, soy sauce, and kombucha.
With the PerkinElmer SimplicityChrom™ Chromatography Data System (CDS) Software, data acquisition and processing were performed. Intuitive, high‑throughput laboratory workflows and real-time data monitoring are both facilitated by the detachable touchscreen interface anywhere the operator is connected to the VPN.
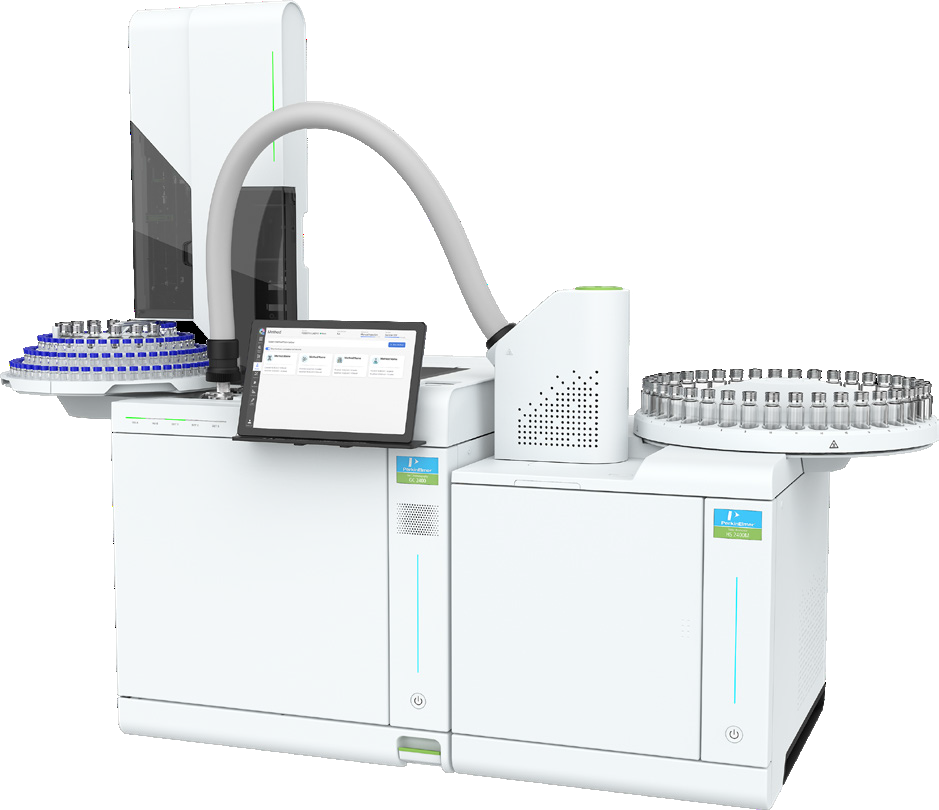
The PerkinElmer GC 2400 System with HS 2400 Headspace Sampler. Image Credit: PerkinElmer
Experimental
Table 1. Instrument operating conditions. Source: PerkinElmer
| System |
Part Numbers |
| Gas Chromatograph |
PerkinElmer GC 2400 System with HS 2400 Headspace Sampler |
-- |
| Injector |
Capillary Split/Splitless (CAP) |
-- |
| Advanced Green Inlet Septum |
N9306218 |
| 1 mm Ultra Deactivated Straight Inlet Liner, no Wool |
N6502037 |
| Detector |
Flame Ionization Detector (FID) |
-- |
| Grade 5 Hydrogen, 30 ml/minute |
-- |
| Grade 5 Air, 400 ml/minute |
-- |
| Grade 5 Nitrogen, 25 ml/minute |
-- |
| Gas Filters |
Triple Filter (Hydrogen & Nitrogen) |
N9306110 |
| Moisture/Hydrocarbon Trap (Air) |
N9306117 |
| Analytical Column |
Elite-BAC1 Advantage Capillary Column; 30 m x 0.32 mm x 1.80 μm |
N9315071 |
| Software |
SimplicityChrom CDS Software |
|
| Headspace Conditions |
|
| Temperatures |
60 °C Oven, 110 °C Needle, 120 °C Transfer Line |
| Pressure |
Grade 5 Nitrogen Gas, 16 psi Pressure |
| Timings |
12 minutes Thermostat, 1 minute Pressurizing, 0.04 minutes Injection, 0.3 minutes Withdraw |
| Transfer Line |
2.0 m 0.32 mm I.D. Fused Silica |
| Options |
Operative Mode: Constant, Inject Mode: Time |
| GC Conditions |
|
| Carrier |
Grade 5 Hydrogen, 12 psi |
| Septum Purge |
3 ml/minute |
| Split |
5 ml/minute |
| Detector Temp |
250 °C |
| Oven |
45 °C Isothermal |
Stock Standard Preparation
Millipore Sigma provided the 200-proof ethanol standard and pure t-butanol internal standard (IS) (Burlington, MA). A filtration system within the laboratory was used to produce a deionized water diluent.
By diluting 1.0 ml of ethanol in DI water volumetrically, the stock ethanol standard was prepared. In a similar method, t-butanol IS was prepared by volumetrically diluting 20.0 ul of pure t-butanol into 100 ml of DI water. When measuring, weights were used, and using the density of ethanol at room temperature (0.789 g/ml), these values were converted to volume. Therefore, stock standards of exactly 0.994% vol/vol ethanol and 0.199% vol/vol t-butanol were prepared.
Calibration Standard Preparation
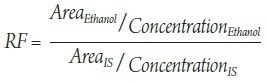
Calibration was performed using static headspace methodology. At a 1:1 ratio with DI water, the stock standard of ethanol was serially diluted into 2 ml autosampler vials until a total of 10 standards were produced ranging from ~1.0% to ~0.0020% vol/vol. By adding 0.750 ml IS solution to 0.075 ml of each of the ten aforementioned serial dilutions, headspace calibration standards were made in 22 ml headspace vials. Linear regression was assessed as well as the response factor (RF) according to the equation, after analyzing each ethanol standard.
Sample Preparation
A local market provided fruit juices, i.e., apple, orange, and pomegranate juice. As well as a soy sauce from the local market, two brands of kombucha were also obtained. Sample preparation was both straightforward and analogous to calibration standard preparation. In a brief outline, 0.750 ml IS and 0.075 ml of each liquid sample were added to a 22-ml headspace vial.
Before pipetting, kombucha samples were permitted to effervesce to maintain volumetric accuracy. If too concentrated for the calibration curve, a sample was diluted with DI water, and this volumetric dilution factor was multiplied by the resultant concentration.
Method Detection Limit (MDL) Study
Calibration standard 10 was made and analyzed seven separate times. To empirically determine the MDL, in each analysis, its concentration was determined and the standard deviation was multiplied by the one-tailed Student’s t value at 6 degrees of freedom. By multiplying the MDL by 0.64 and 2.2, respectively, the upper (UCL) and lower confidence limits (LCL) were determined.
Results & Discussion
System Performance
Over the concentration range analyzed, calibration was exceptionally linear. Figure 1 presents the curve for ethanol by HS-GC/FID. Indicating high system performance, linear regression brought about an R2 of 0.9999. Good precision was shown by the response factor (RF) as represented by the relative standard deviation (RSD) of 3.44% depicted in Table 2.
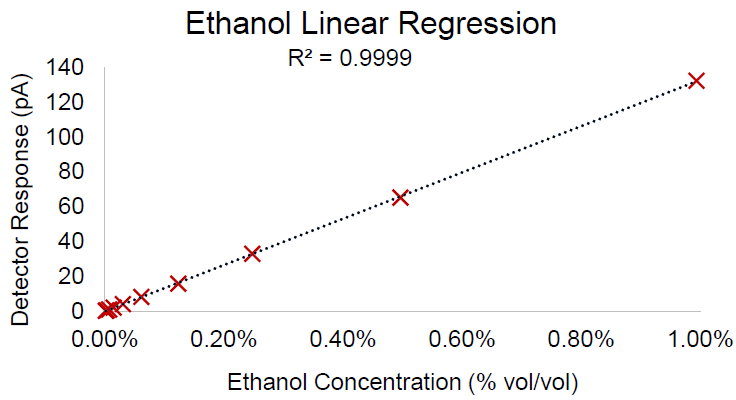
Figure 1. Calibration curve for ethanol by headspace GC/FID. Image Credit: PerkinElmer
Table 2. Response Factor and system performance parameters for ethanol calibration against t-butanol internal standard. Source: PerkinElmer
| Ethanol:t-Butanol RF |
RF Standard Deviation |
RF RSD |
| 0.234 |
0.0080 |
3.44% |
For Standard 1 (most concentrated), chromatograms are presented in Figure 2A, and for Standard 10 (least concentrated), in Figure 2B. An inset of Standard 10 is shown in Figure 2C, highlighting the acceptable signal/ noise ratio at the lowest concentration analyzed.
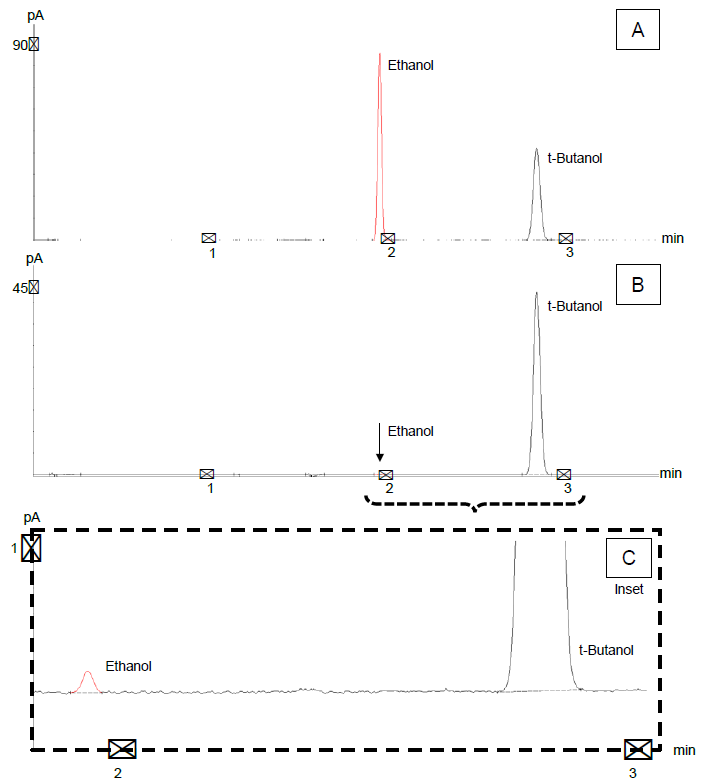
Figure 2. Calibration standard chromatograms of (A) ~1.0% vol/vol standard, (B) ~0.0020% vol/vol standard, and (C) inset of low-level standard highlighting signal/ noise at low end of calibration curve. Image Credit: PerkinElmer
From analysis of calibration, standard 10 was performed seven times on different headspace vials, and the ethanol method detection limit (MDL) was determined. The MDL, LCL, and UCL of ethanol are listed in Table 3.
Table 3. MDL, LCL, and UCL for ethanol by HS-GC/FID. Source: PerkinElmer
| MDL |
LCL |
UCL |
| 0.000273% |
0.00017% |
0.00060% |
These results show that, in addition to being highly robust, ethanol quantitation using the PerkinElmer GC 2400™ with Elite-BAC1 Advantage capillary GC column is sensitive.
Sample Quantitation
For alcohol content, three commercial juices, two kombucha brands, and one soy sauce were each measured. The results for these items are provided in Table 4. Though soy sauce contained the most ethanol, pomegranate juice contained a barely-detectable quantity. Soy sauce was diluted volumetrically in DI water at a ratio of 1:4 soy sauce: water and the measured value was multiplied by this dilution factor since soy sauce’s concentration was above the calibration curve limit.
Notably, one of the two kombucha brands exceeded the US regulatory limit for ethanol by 0.22% vol/vol, nearly 50% over the limit of 0.50% vol/vol, despite being purchased within the United States. This may be attributable to post-bottling fermentation from the active microbial colony.
Table 4. Results of the survey of foods from a local market for ethanol content. Source: PerkinElmer
| Sample |
Ethanol % vol/vol |
| Apple Juice |
0.045% |
| Orange juice |
0.005% |
| Pomegranate Juice |
< Limit of Quantitation |
| Kombucha Brand 1 |
0.719% |
| Kombucha Brand 2 |
0.140% |
| Soy Sauce |
3.162% |
A Note About Ionic Strength
High ionic strength is possessed by a sample with a large salt content, which increases the gas-phase partitioning of organic compounds from the solution.
Within headspace analysis,6 adding salt to the solution is a typical method used to increase sensitivity. For organic compounds in particularly salty samples, this can reduce quantitative accuracy when no salt was used in calibration.
In every standard and nearly every sample, t-butanol internal standard response was remarkably consistent except for soy sauce, which is very salty. Producing a t-butanol response of 113.8 ± 1.7 pA, with values ranging from 111.0 to 116.1 pA, the average of 16 calibration standards (including 7 MDL tests of calibration standard 10) was precise. Responses within this range were also produced by fruit juice and kombucha samples.
The undiluted soy sauce sample is extremely salty (960 mg/tbsp), on the other hand, and produced a t-butanol response of 10.5% above the aforementioned average, at 125.8 pA. If RF is used to quantitate ethanol, the ionic strength deviation will skew the resultant ethanol concentration. Soy sauce’s ionic strength lowered and the diluted sample produced an internal standard response of 115.9—within the span of expected values - when it was diluted at a 1:4 ratio with DI water. It is important to account for deviations in partition coefficient by performing a comparison of sample internal standard response against those from the calibration curve when quantifying high ionic strength samples. When the sample concentration falls within the calibration curve, diluting a salty sample with DI water may be an appropriate remediation.
Conclusion
For fast, robust, and sensitive analysis of alcohol in food, the PerkinElmer GC 2400 System is ideal. Excellent linearity (R2 = 0.9999) was obtained by calibration from ~1.0% vol/vol to ~0.0020% vol/vol with method sensitivity down to 0.00027% vol/vol.
For alcohol composition, such as fruit juices, kombucha, and soy sauce, a variety of liquid samples were successfully analyzed.
T-butanol internal standard acted as an indicator of the impacts of ionic strength on the static headspace partitioning of organics, in addition to aiding quantitation.
References
- United States Code of Federal Regulations. 27 C.F.R. § 25.11
- Government of Canada. Labelling Requirements for Alcoholic Beverages. 2021.
- European Union. Regulation No. 1169/2011. 2011.
- Jawad Alzeerab and Khaled Abou Hadeed. Ethanol and its Halal Status in Food Industries. Trends Food Sci. & Technol. 2016. 58: 14-20.
- Nathan Kuffel and Timothy Ruppel. A Method for the Quantification of Ethanol Content in Consumable Fruit Juices by Headspace Injection. PerkinElmer Inc
- Emma Hollender and Edward W. Hammersley. Ionic Liquids: Sensitivity Enhancement in Headspace Gas Chromatography. Chromatography Today. 2011

This information has been sourced, reviewed and adapted from materials provided by PerkinElmer.
For more information on this source, please visit PerkinElmer.