Sponsored by PerkinElmerReviewed by Olivia FrostSep 15 2022
The US Environmental Protection Agency (EPA) has, since the early 2000s, implemented a series of initiatives designed to promote the widespread use of renewable fuels, with a target of 136 billion liters of renewable fuel to be combined with gasoline by 2022.1 So far, ethanol is the primary renewable fuel used for transportation in the US.2,3
The production of vehicles running high-ethanol-content gasoline blends (known as flex fuels) has increased during this same period. Due to their reduction in greenhouse gas emissions (at least 40% in comparison to gasoline), 4 as well as their reduced volatility/vapor loss during transport and storage when compared to traditional high-petroleum gasoline blends,5 such fuels have garnered attention.
Flex fuels need to be analyzed before their use to determine the amount of ethanol and methanol they contain and to support the assessment of product quality to determine their final use.
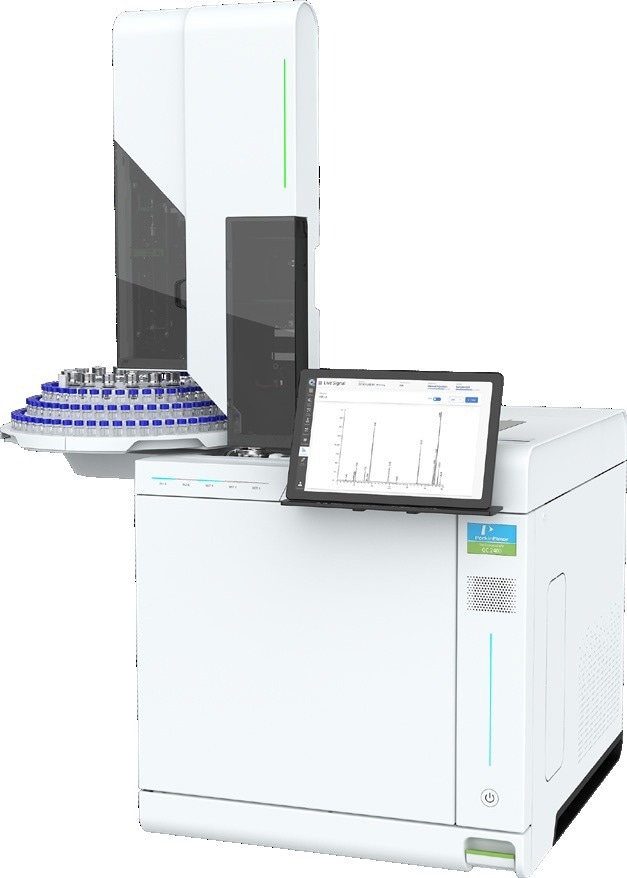
PerkinElmer GC 2400 System. Image Credit: PerkinElmer
Guidelines for analysis of flex fuels using a 150-meter Detailed Hydrocarbon Analysis (DHA) analytical column are provided by the ASTM Method D5501,6 last updated in 2020. While methanol content cannot exceed 0.6% w/w ethanol, flex fuels are permitted to contain between 51% and 83% w/w. A robust calibration procedure is required by the wide range of target analyte concentrations. Enhanced resolution of methanol from co-eluting C4 hydrocarbon isomers is facilitated by the long analytical column.
The performance of the PerkinElmer GC 2400™ System for the analysis of E85, according to the ASTM Method D5501, is shown in this article. Regarding the ASTM Method D5501- 20 analysis, the GC 2400 System provides quantitative repeatability and ideal separation efficiency.
Intuitive, high-throughput laboratory workflows and the real-time monitoring of data anywhere the operator is connected to the VPN is enabled through the PerkinElmer SimplicityChrom™ Chromatography Data System (CDS) Software and the detachable touchscreen interface. For polar hydrocarbon analysis, the PerkinElmer Elite DHA-150 column provides an inert separation environment and excellent peak shape.
Experimental
Table 1. GC Parameters. Source: PerkinElmer
| GC Parameters |
|
|
| Instrument |
PerkinElmer GC 2400 System |
-- |
| Injector |
Capillary Split/Splitless (CAP) with Autosampler |
-- |
| Advanced Green Inlet Septum |
N9306218 |
| Green FocusLiner |
N6502041 |
| 5 uL Autosampler Syringe |
N6402186 |
| Detector |
Flame Ionization Detector (FID) |
-- |
| Grade 5 Hydrogen, 35 mL/minute |
-- |
| Grade 5 Air, 400 mL/minute |
-- |
| Grade 5 Nitrogen, 25 mL/minute |
-- |
| Gas Filters |
Triple Filter (Hydrogen & Nitrogen) |
N9306110 |
| Moisture/Hydrocarbon Trap (Air) |
N9306117 |
| Analytical Column |
PerkinElmer 150 m x 0.25 mm x 1.0 μm |
N6107239 |
| Graphite/Vespel Ferrules, 0.4 mm I.D. |
09920104 |
| Software |
SimplicityChrom CDS Software |
-- |
Spectrum Quality Standards (Houston, TX) provided the calibration standards spanning 20%-99% w/w ethanol, 0.1% - 0.6% w/w methanol, and 0.5%-10% w/w heptane, with heptane as the representative hydrocarbon standard. VWR (Radnor, PA) provided the iooctane diluent. A local gas station in Stamford, CT provided the E85 gasoline.
Calibration standards were analyzed following triplicate blanks, and the measurements were performed for repeatability. For the three analytes, linear regression was performed. If the correlation coefficient, R2, satisfied the criterion R2 ≥ 0.995 over the range analyzed, the calibration curve was considered linear. A fourth blank was employed prior to the E85 sample after calibration. The measurement was performed five times, and the E85 sample was run as a neat solution.
Method detection limit (MDL) analysis was performed in accordance with USEPA guidelines7. A brief outline of the proceedings was found as follows: by diluting the lowest concentration calibration standard in isooctane an ethanol standard was prepared at an estimated concentration of 10x the anticipated MDL. The prepared ethanol standard was analyzed seven times. The MDL was calculated using the following formula: MDLethanol= SDethanol * Student’s t, where SD is the standard deviation of the seven ethanol standard trials and the value of Student’s t is 3.14, which corresponds to the one-handed t-test value at 6 degrees of freedom and 99% confidence.
As Figure 1 shows, the calibration procedure was a success, with R2 meeting the criterion for each analyte regression. A calibration standard chromatogram is shown in Figure 2A. The vast difference in calibrated concentrations between methanol and ethanol is highlighted by the barely detectable methanol peak.
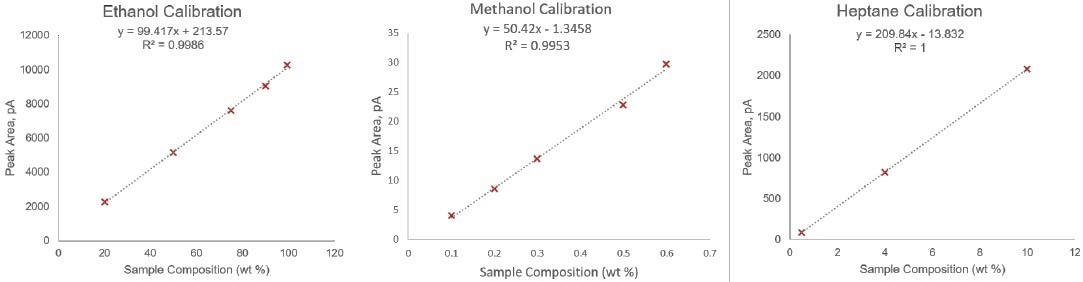
Figure 1. Calibration set results for ethanol, methanol, and heptane. Note: In 3 of the 5 standards, heptane was kept at a 10% concentration; results are presented for this average. Image Credit: PerkinElmer
The E85 flex fuel sample chromatogram is shown in Figure 2B. The fact that small, polar organic compounds, such as methanol and ethanol, are prone to significant peak tailing is warned by the ASTM Method D5501-20. Figure 2C, in our case, demonstrates no observable peak tailing for these compounds.
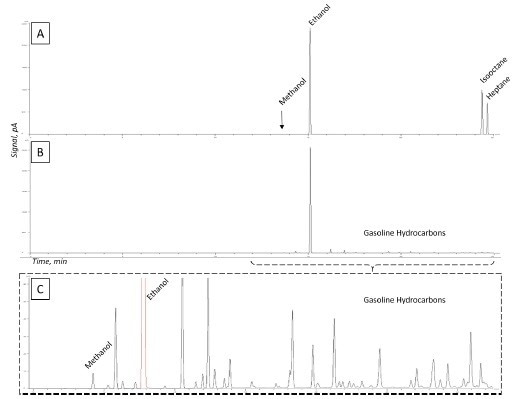
Figure 2. Chromatograms of an analytical standard (A), sample chromatogram (B), and close-up of low-level sample components (C). Image Credit: PerkinElmer
An inert flow path is provided by the Elite DHA-150 column, which created excellent gaussian peak shapes for small polar organic compounds. These compounds do not differ significantly in appearance from neighboring nonpolar gasoline hydrocarbons.
Results and Discussion
Good analytical precision is displayed by the system. As is shown in Table 1, ethanol was measured in the flex fuel with 1.15% relative standard deviation (RSD), with very high repeatability indicated. While still within an acceptable range, the RSD for methanol was slightly greater as a result of its low concentration in the sample.
The robustness of the GC 2400 System for fuel alcohol analysis over a wide range of sample concentrations is demonstrated by this data, making it an ideal solution for ASTM D5501-20 analysis.
A method detection limit (MDL) study was performed to exemplify the wide analytical dynamic range of the GC 2400 System with FID Detector. However, it is beyond the scope of ASTM Method D5501‑20.
In seven replicates, a standard measured at ~0.03% concentration was analyzed, the results of which are shown in Table 2. As is shown in Table 3, an MDL of 0.0025% was obtained, and the upper confidence limit (UCL) and lower confidence limit (LCL) concentrations. Remarkably, such low detection limits are achievable, spanning over five orders of magnitude difference, considering that this method can quantify 99 wt% ethanol.
Table 2. Measurement conditions. Source: PerkinElmer
| Conditions |
|
| Carrier |
Grade 5 Hydrogen, linear velocity control at 21 cm/sec |
| Septum Purge |
3 mL/minute |
| Split |
300 mL/minute |
| Injection Volume |
0.5 μL |
| Injector Temp. |
250 °C |
| Detector Temp |
300 °C |
| Oven |
60 °C for 15 minutes, 30 °C/minute to 250 °C, hold for 23 minutes |
Table 3. Repeatability test results from n=5 sample analyses. Source: PerkinElmer
| Component |
Commercial E85 Sample Alcohol Composition (wt %) |
| Run 1 |
Run 2 |
Run 3 |
Run 4 |
Run 5 |
Average |
RSD |
| Ethanol |
80.2 |
78.4 |
80.1 |
78.5 |
80.0 |
79.4 |
1.15% |
| Methanol |
0.56 |
0.55 |
0.54 |
0.51 |
0.53 |
0.54 |
3.63% |
Table 4. MDL concentration results showing high precision at the lowest end of the linear range. Source: PerkinElmer
| Ethanol MDL Composition (wt %) |
| Run 1 |
Run 2 |
Run 3 |
Run 4 |
Run 5 |
Run 6 |
Run 7 |
Average |
SD |
RSD |
| 0.030 |
0.031 |
0.031 |
0.030 |
0.031 |
0.031 |
0.029 |
0.031 |
7.84 E04 |
2.57% |
Table 5. Method detection limit and upper and lower confidence limits. Source: PerkinElmer
| Ethanol Detection Limits (wt %) |
| MDL |
LCL |
UCL |
| 0.0025 |
0.0016 |
0.0054 |
Conclusion
For assessing product quality, the analysis of Flex Fuels (E85) according to ASTM D5501 is significant in determining the content of methanol and ethanol in fuels. The requirements of ASTM D5501 were either met or exceeded by the results obtained by the GC 2400 System.
Good analytical precision was displayed by the GC 2400 System, while it demonstrated robustness for fuel alcohol analysis over a wide range of sample concentrations.
References
- R. Suarez-Bertoa, A.A. Zardini, H. Keuken, C. Astorga, Impact of ethanol containing gasoline blends on emissions from a flex‑fuel vehicle tested over the Worldwide Harmonized Light duty Test Cycle (WLTC), Fuel, Volume 143, 2015, Pages 173-182, ISSN 0016-2361, https://doi.org/10.1016/j.fuel.2014.10.076.
- M. Balat, H. Balat, C. Öz, Progress in bioethanol processing, Prog Energy Combust Sci, 34 (2008), pp. 551-573
- T .D. Durbin, J.W. Miller, T. Younglove, T. Huai, K. Cocker Effects of fuel ethanol content and volatility on regulated and unregulated exhaust emissions for the latest technology gasoline vehicles Environ Sci Technol, 41 (2007), pp. 4059-4064
- https://afdc.energy.gov/vehicles/flexible_fuel_emissions.html
- American Society for Testing and Materials. Method ASTM D5501-20. 2020.
- U.S. EPA. 51 FR 23703, Definition and Procedure for the Determination of the Method Detection Limit, Government Printing Office, Washington, D.C., 1986.

This information has been sourced, reviewed and adapted from materials provided by PerkinElmer.
For more information on this source, please visit PerkinElmer.