Sponsored by PerkinElmerReviewed by Olivia FrostAug 30 2022
The use of nanocomposites, which use small-scale particle fillers to enhance the characteristics of thermoplastics and thermosets, has attracted a lot of attention in recent years. For instance, adding filler particles on such a small scale can toughen plastics, lessen vapor transfer, and increase transparency.
Nanocomposites have applications in the fields of medicine, electronics, building, energy storage, transportation, and packaging. Additionally, given that nanocomposites can tolerate pressure and extremely hot or cold temperatures, interest in researching their potential applications for aerospace and spaceflight is growing.
Nanocomposites come in a variety of forms, including epoxy, polymers, and materials made of carbon tubes. Materials that have at least one phase with dimensions in the nanoscale range are embedded into one another to create nanocomposites. A specific property of the material is enhanced or improved by this technique.
Nanotube-polymer composite windmill blades can be made using common nanocomposites, such as epoxy, that contains carbon nanotubes. As a consequence, the blade is sturdy but light. Polymer nanocomposites are also often employed in the automobile sector since they provide lightweight car components that help increase a vehicle’s fuel efficiency.
Measuring the impact of a filler formulation on the change in specific heat is a quick technique to calculate its impact (Cp) that arises at the glass transition (Tg).
In this study, deliberated by Christophe Schick,1 the Cp of an amorphous nanocomposite can be divided into three entities in a meaningful way:
(1) The mobile amorphous fraction, an undamaged amorphous polymer with characteristics identical to those of pure amorphous polymers
(2) The Cp of the filler itself; and
(3) The rigid amorphous fraction (RAF), or Cp, of the immobilized polymer, which is caused by its adhesion to the nanoparticle.
The size of these fractions can be connected to the composite’s characteristics.
The strength or weakness of the chemical link between the RAF and the nanomaterial filler may be a sign of the functionality of the nanocomposite as well as how quickly it will degrade in the environment. A second Tg, devitrification of the RAF, would suggest that the link between the RAF and the nanomaterial filler is not very strong.
Background
Christophe Schick verified the use of the HyperDSC® method to access RAF and to search for signs of RAF devitrification between the glass transition temperature and room temperature (Tg) and the rate-suppressed start of decomposition.
He confirmed how this Cp data, made precise by collateral use of StepScan™ procedures, could be associated with the Cp function of neat polymer to further assess the degree of agglomeration of filler in a nanocomposite.1
His paper’s main connection for calculating the RAF in a composite is as follows:
Where ΔCp and ΔCp pure are the variations in specific heat at the glass transition temperature, Tg, for the composite and unfilled polymer, correspondingly.
The method put forth in this article offers an alternative approach for calculating Cp that makes use of rapid rates of heating and cooling to acquire quantitative Cp in the upper temperature region without having to stay in that high-temperature area for extended periods of time to create an upper isothermal.
In the standard procedure to test Cp (ASTM® E1269), a sample is adjusted at a low temperature, heated at a rate to an upper temperature, and then warmed again while maintaining the same temperature until complete equilibration.
The issue with the traditional Cp technique, as well as modulated temperature approaches, is that when stored at high temperatures, the sample is prone to deteriorate, endangering the measurement’s accuracy.
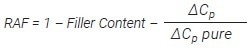
The method presented here involves heating the sample (and baseline) at an extremely rapid pace (in this case, 400 °C/minute), reaching the upper temperature, and then rapidly cooling the sample at the same rapid rate to a temperature low enough to prevent significant sample breakdown. The raw data, comprising sensor temperature and heat flow, are displayed in Figure 1.
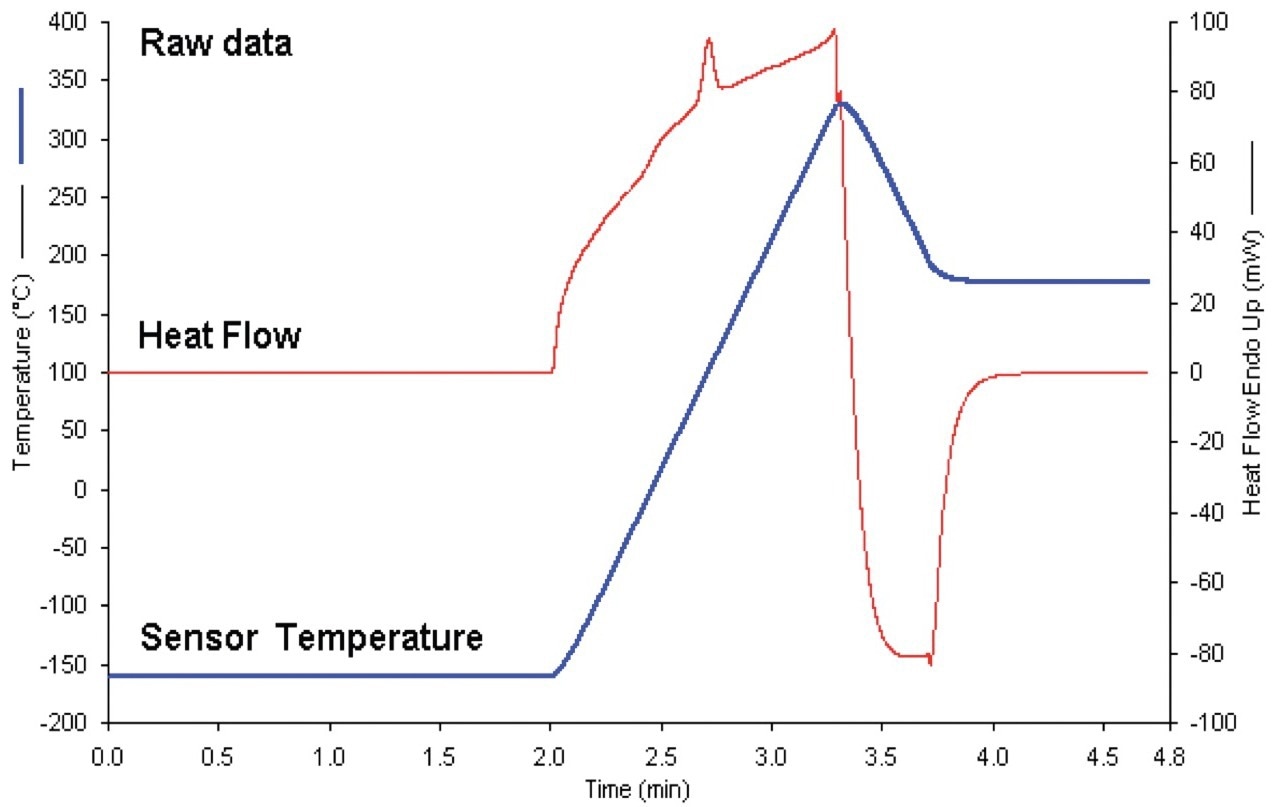
Figure 1. Raw data for thermoplastic polyurethane nanocomposite using the 400 ˚C/min heat-cool Cp method – analysis time: 5 minutes. Image Credit: PerkinElmer
Experimental and Data Handling
The PerkinElmer® DSC 8500, a power-controlled, dual-furnace differential scanning calorimeter (DSC) with the capacity to scan at rates up to 750 °C/minute and accomplish fast equilibration, which is required when employing rapid scan rates, was the instrument used for this investigation.
Helium served as the purging gas. The CLN2 liquid nitrogen cooling accessory was used to provide cooling at the −180 °C block heat sink temperature.
Indium and lead, two melting standards, were employed for calibration. Aluminum HyperDSC pans were used for encapsulation because they have a low mass and offer the best thermal coupling (Part No. N5203115).
All runs are dynamically moved and slanted to zero heat flow by using final heat flow values of the lowest and highest temperature isotherms when the AutoSlope function of PerkinElmer PyrisTM software is activated in Preferences.
After subtracting the baseline data that was iso-aligned, choose Single Curve Cp from the Calculate/Specific Heat menu to transform to Cp units. The outcome is a particular heat data curve as a proportion of the tested temperature that may be charted, examined further, and stored (Figure 2).
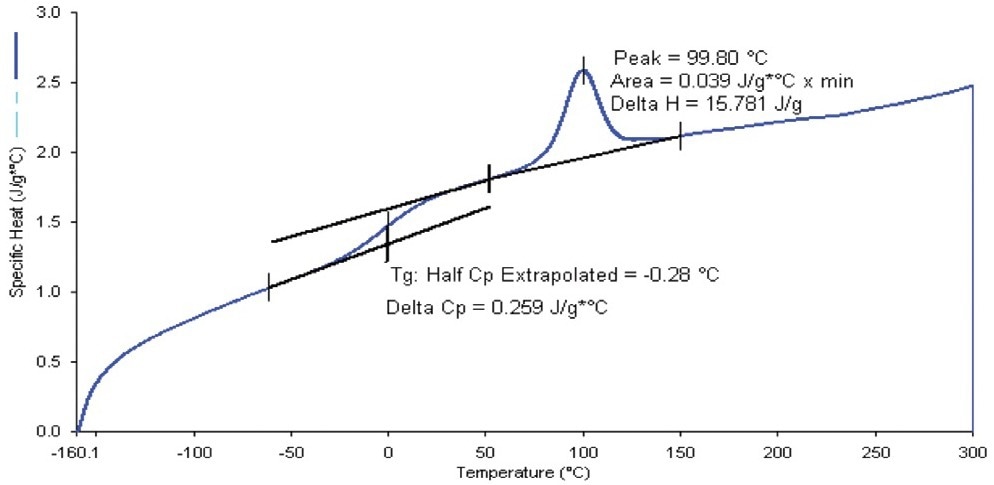
Figure 2. Specific heat capacity data for thermoplastic polyurethane composite using the 400 °C/min heat-cool Cp method, with Tg and peak calculations applied. Image Credit: PerkinElmer
With the use of this technique, the heat could be measured up to 300 °C without significant decomposition bias. Tables prepared in Pyris and then imported into a spreadsheet were used to convey the data to the nanocomposite supplier (Figure 3).
Figure 3. Microsoft® Excel® spreadsheet, for further analysis of Cp data, after transferring a table from Pyris software. Image Credit: PerkinElmer
Assessing Method Accuracy
The purpose of this experiment was to demonstrate that the more time-consuming StepScan examination would not be necessary if the specific heat capacity data generated via HyperDSC were precise enough.
The smaller of the two sizes of sapphire-specific heat standards in the PerkinElmer Specific Heat Kit (Part No. 02190136) was also examined to show consistency using the same technique that generated the data above. The Cp findings were then compared to those in the kit’s accompanying table.
The 400 °C/minute findings agreed with literature values within 1.5% up to 320 °C and 1% from −50 °C to 200 °C.
The sapphire test has shown that the new technique can be incredibly accurate with suitable sampling preparation, even though this precision may be a little less when operating plastics samples due to superfluous effects (e.g., sample inhomogeneity, water loss, sample motion, less than optimal thermal coupling).
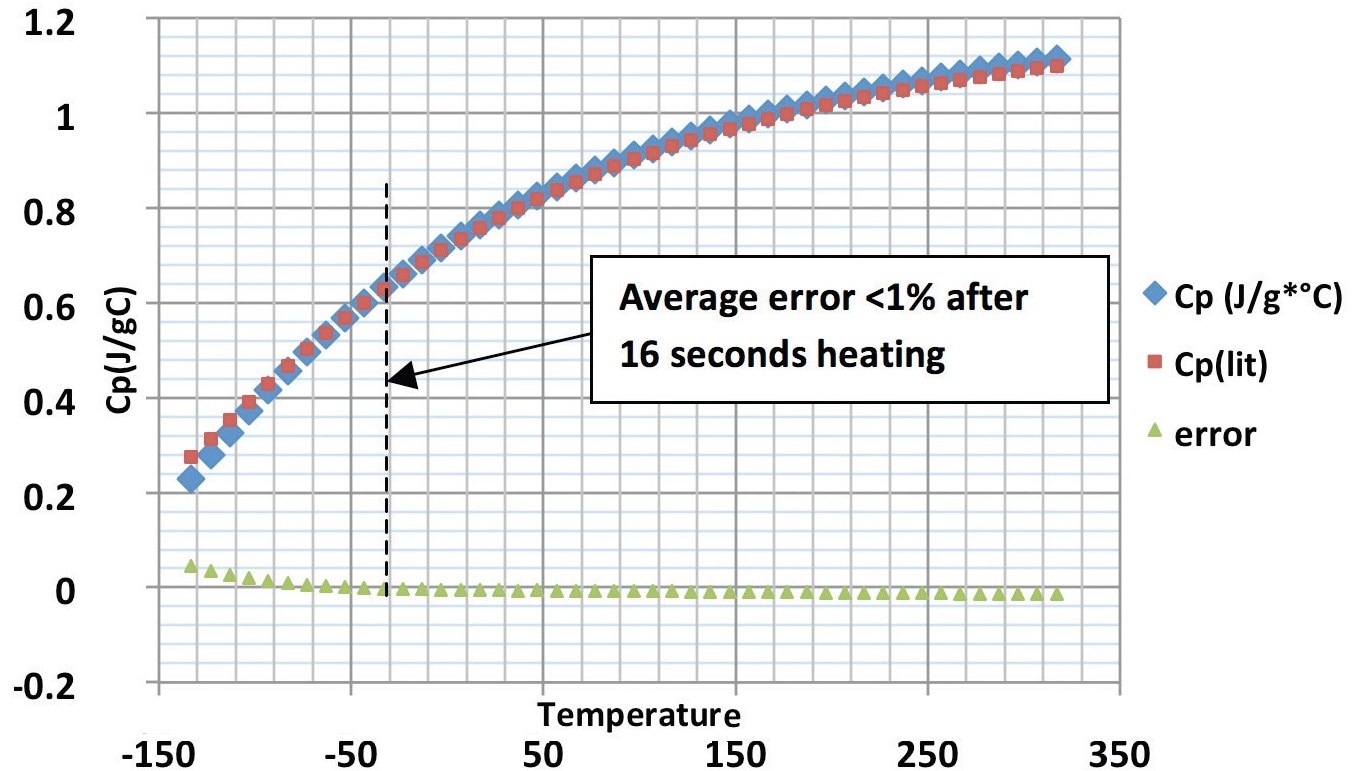
Figure 4. Specific heat capacity of sapphire using the 400 °C/min heat-cool method, showing Pyris data, literature data and error. Image Credit: PerkinElmer
Looking for Evidence of Devitrification
The Schick et al. (2007) experiment sought proof that, at extremely high temperatures, kinetic energy might loosen the tightly bound polymer and disclose a second, higher and weaker glass transition attributable to devitrification of the RAF phase.
To access the high-temperature area and collect precise heat data while kinetically postponing the start of decomposition, the HyperDSC approach was used.
However, the researchers wanted to offer a quick means of evaluating alternative formulations for this impact as no indication of this devitrification function was provided in the formulation that was tested.
Researchers saw some indications of increasing Cp at higher temperatures in the (proprietary) nanocomposite samples examined, but more investigation is needed, including the examination of the unfilled polymers, before any firm conclusions can be made concerning devitrification.
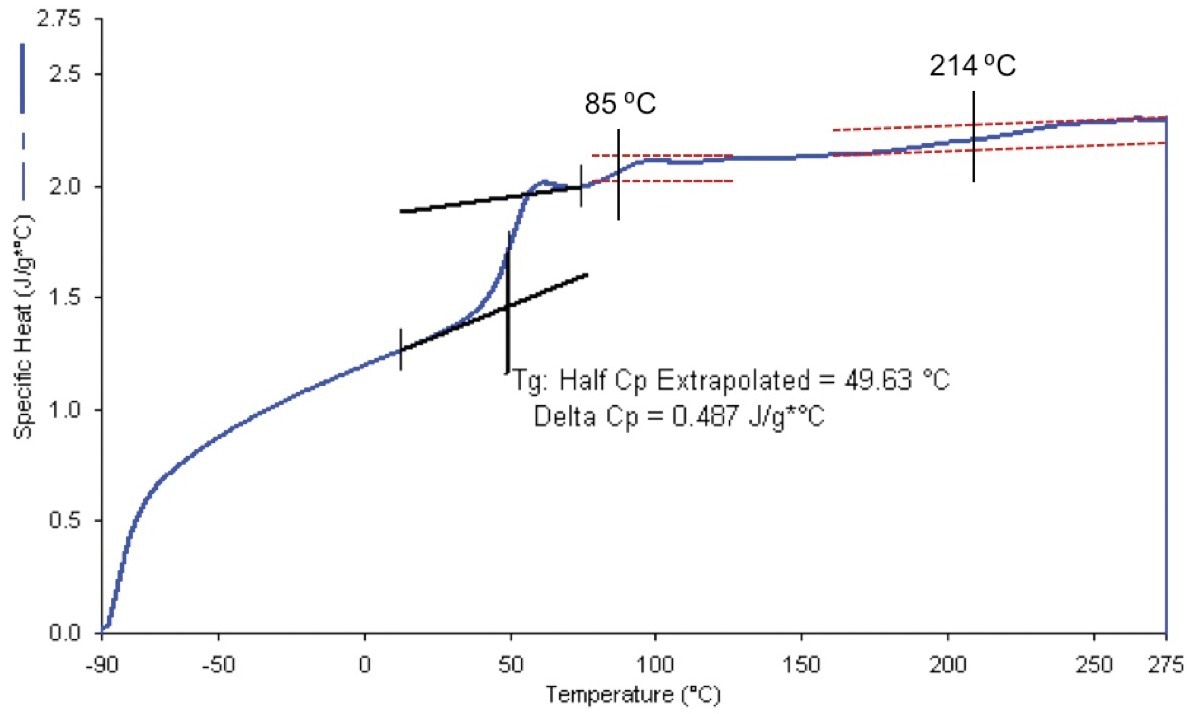
Figure 5. Specific heat capacity of uncured epoxy nanocomposite using the 400 ˚C/minute heat-cool method, showing possible second Tgs. One interpretation of this data is that the multiple Tgs are due to devitrification of RAF. Not all portions of this sample showed this effect. The sample for analysis was visibly inhomogeneous. Note: at normal DSC scan rates, or when using a modulated technique, decomposition would show additional thermal effects above 200 °C, which would mask evidence of devitrification. Image Credit: PerkinElmer
Conclusions
HyperDSC has the potential to clarify nanocomposites. The top temperature range for which precise particular heat capacity tests are feasible is increased by the use of a quick heat–cool approach, as illustrated here.
This ought to make it easier to spot the devitrification or lack of nanocomposite bonding that occurs in amorphous polymer systems. Through the use of this technique, metastable states of polymer systems can be further investigated using power-controlled DSC.
References
- Sargsyan, A. Tonoyan, S. Davtyan, C. Schick, The amount of immobilized polymer in PMMA SiO2 nanocomposites determined from calorimetric data, Eur. Polym. J. 43 (2007) 3113-3127.

This information has been sourced, reviewed and adapted from materials provided by PerkinElmer.
For more information on this source, please visit PerkinElmer.