Sponsored by PerkinElmerReviewed by Olivia FrostAug 30 2022
The aliphatic polyketone copolymers (PK copolymer) are composed of a perfectly alternating copolymer of carbon monoxide and ethylene. Despite being a relatively new family of polymers, these copolymers are used in numerous sectors of the economy.
Many desirable engineering thermoplastic characteristics, including high-tensile yield stress and superior impact performance, are displayed by PK copolymers. This polymer class is a new, special thermoplastic for engineering applications due to its high level of chemical resistance and exceptional barrier characteristics.
They are a great option for vehicle components in the automotive sector because of their excellent mechanical and tribological qualities.
They are employed in the production of mechanical parts that must withstand high stresses, such as gear wheels, bushings, and bearings. PK copolymers are also applied in the fuel system and batteries due to their strong barrier qualities and chemical resistance.
Polyketone Copolymers are used extensively in production, so it is important to make sure the material adheres to the specifications.
The reactor product is a white, semi-crystalline powder that, after washing and drying, is only soluble in a small number of unusual solvents, such as hexafluoro-isopropanol (HFIPA) and meta-cresol.
This polymer’s crystalline phase is composed of orthorhombic unit cells with one polymer chain in the middle and one at each of the four corners. These polymer chains condense into alpha and beta modification, respectively. At temperatures higher than 120 °C, the alpha modification transforms into the beta form of the material.
At roughly 250 °C, the beta form material, which serves as the (unoriented) PK copolymer’s main unit cell, fuses.
The sizes of both cell types were determined by Lommerts et al.2. Alpha form a = 6.91 Å, b = 5.12 Å, c = 7.60 Å; cryst. density = 1.382 g/cm3. For the beta form, a = 7.97 Å, b = 4.76 Å, c = 7.57 Å; cryst. density = 1.297 g/cm3.
The density enhancement that results from the ordinary beta phase material being transformed into alpha phase material could even further improve the barrier qualities (the structure and extent of the crystalline phase are key factors in determining the barrier properties).
PK copolymer was studied to see if and how the beta phase material could be changed into the alpha phase material.
After heating across the alpha/beta crystal transition, as indicated by Tm, alpha crystallinity effects caused by polymerization-solvent-induced and pressure/shear forces-induced factors become (partly) irreversible.
Thirdly, thermally induced alpha crystallinity, which is achieved by annealing materials at a temperature just below the melting point of the beta crystalline phase, was discovered to be entirely reversible.3
Thus, PK copolymer systems with high alpha/beta crystal ratios were created using this technique. For the purpose of evaluating the potential effects of storage duration on the alpha/beta ratio, a series of three such samples were set aside.
There were numerous issues with the traditional DSC analysis of these materials utilizing a PerkinElmer® DSC 7. These were the top three issues:
- Uncertainty about proper Tm1 values in connection with clearly present re-crystallization effects during the main fusion process
- Tm1 (max) value uncertainty (cross-linking reactions, perhaps already underway during the fusion, could affect the observed Tm1 values)
- For the PK copolymer, it was not able to investigate the amorphous phase, i.e., to determine the Tg-value using traditional DSC
Recent advancements in high-speed DSC offer numerous benefits over traditional DSC. The best fast scan DSC method available is HyperDSC® by PerkinElmer. It calls for a DSC instrument with a very high resolution and a very quick response time. It enables rapid linear heating and cooling scanning across a wide temperature range (up to 500 °C/minute).
HyperDSC can suppress kinetic events during scanning in addition to offering better sensitivity, allowing it to analyze the sample exactly as it was given. As the advantages of the HyperDSC were reviewed, it became apparent that this improved approach might offer the answers being sought after.
Experiment
The samples utilized for this study and how they were treated are schematically depicted in Appendix I as functions of temperature and time. To measure these samples, the following experiment settings were employed in 2005:
Instrument: PerkinElmer Pyris 1 DSC*
Sample mass: 1 mg (approximately)
Heating/cooling rate: 300 °C/minute
Number of scans: First and second heating scans were taken for each sample
Temperature range: –100 °C to +300 °C
High-purity indium and lead were used to calibrate the HyperDSC for temperature and enthalpy responses. Prior to and during the measurements, the systems’ baseline was verified (Figure 1).
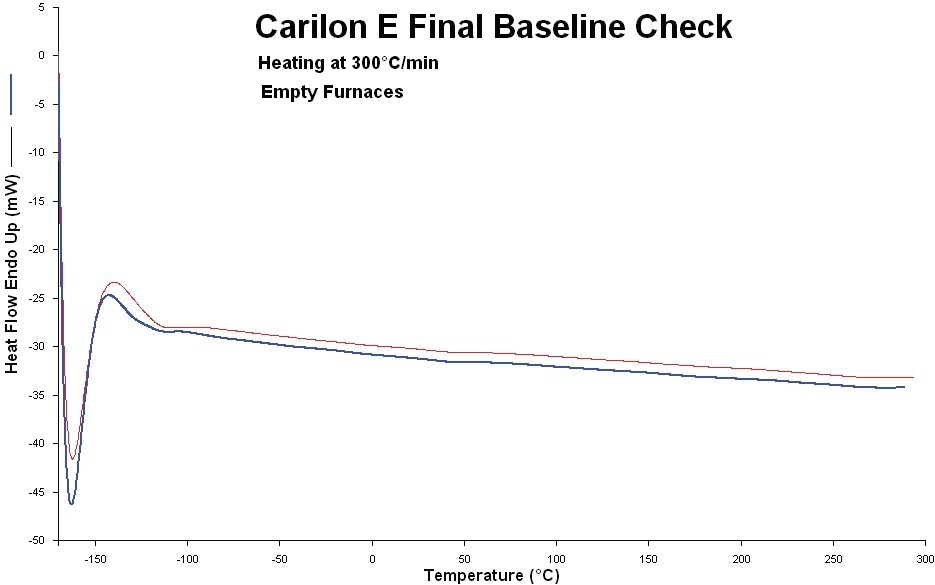
Figure 1. System baseline before and after the experiments (red: before, blue: after). Image Credit: PerkinElmer
The data was collected in 1993 using a PerkinElmer DSC 7 with a 20 °C/minute scanning rate.
Results
Experiment and Calculated Values
A number of exploratory experiments were conducted before the main investigation to validate the reported Tm1(max) value of 258 °C±1 °C (20 °C/minute).3 Tm1(powder) for a reactor powder sample measured at a heating rate of 300 °C/minute was 258.6 °C and 256.6 °C.
As a result, the Tm1 value assessment demonstrated that it was not, or only minimally, affected by potential cross-linking effects.
Figure 2 displays the findings of the first and second thermal scans performed in 2005 on Sample 1. The alpha phase crystallinity that was present in this sample (see alpha/beta crystal transition between approximately 100 °C and 150 °C) totally vanished at the beginning of the second heating scan, as shown by both curves.
The beta crystalline phase’s fusion process was then evidently switched to lower temperatures in the second scan.
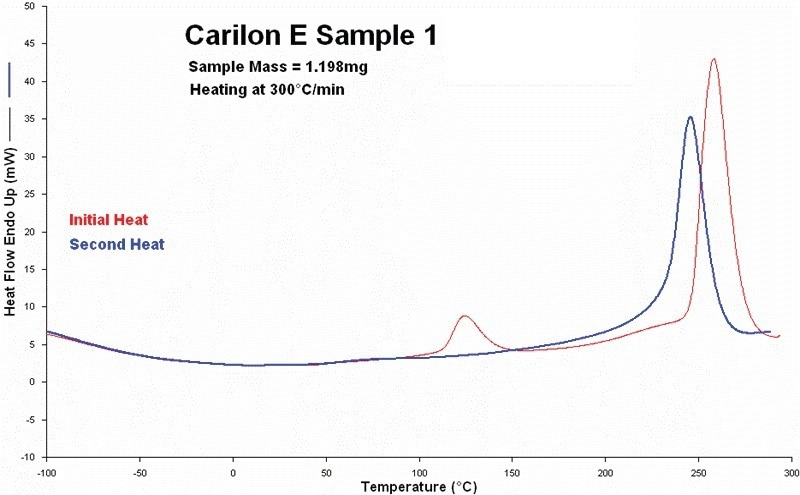
Figure 2. First and second heating scans measured on sample 1. (in 2005). Red curve is initial heating and blue curve is second heating. Image Credit: PerkinElmer
The possibility of both effects being connected was thus highlighted. To better understand the fusion processes, Figures 3 and 4 were used to summarize both fusion effects in Tm and Hf values (results are provided in Table 1). The fusion endotherms of the three samples are shown in Figure 3A in 1993 at the usual heating rate.
Table 1. High and low heating rate results measured on PK copolymers. Source: PerkinElmer
| Sample Code |
Alpha Cryst. Phase |
Beta Cryst. Phase |
| Tm * °C |
Hf * J/g |
Tm1 C |
Hf1 J/g |
| 1. 1993** |
111.8 |
8.3 |
252 |
116.1 |
| 1. 2005*** |
124.4 |
18.2 |
258 |
126.9 |
| 2. 1993 |
106.3 |
5.1 |
251.8 * |
116.0* |
| 2. 2005 |
124.2 |
15.8 |
257 |
126.1 |
| 3. 1993 |
- |
- |
249.4 * |
112.0* |
| 3. 2005 |
109 |
4.3 |
252.7 |
118.2 |
* corrected by calculation, see text.
** (1993) low, i.e. 20 °C/minute heating rate experiments.
*** (2005) high, i.e. 300 °C/minute heating rate experiments.
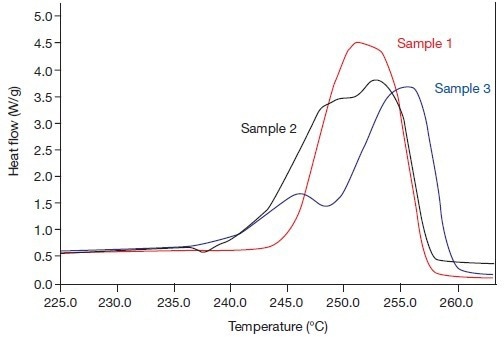
Figure 3A. The beta phase fusion effects of the systems 1, 2, and 3 (in 1993), i.e., heating rate 20 °C/min. Image Credit: PerkinElmer
The results in Figure 3B are identical when measured in 2005 at a speed of 300 °C/minute. Both images demonstrate how recrystallization effects during the fusion process obviously had an impact on the fusion endotherms of samples 2 and 3 in 1993. In the three endotherms that were measured at a high rate in 2005, these impacts were (barely) discernible.
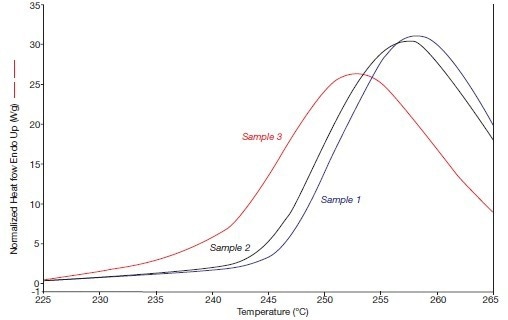
Figure 3B. The beta phase fusion effects of the systems 1, 2, and 3 (in 2005), i.e., heating rate 300 °C/min. Image Credit: PerkinElmer
The alpha/beta crystal transitions of these samples are depicted in Figures 4A and 4B. Figure 4A depicts the anticipated outcome, which is sample 3 (1993) exhibiting no annealing, no alpha crystallinity, and no alpha/beta crystal transition, as well as an intensifying alpha/beta crystal transition with increasing annealing periods.
Figure 4B displays the alpha/beta crystal transitions that were observed in 2005 when the heating rate was high.
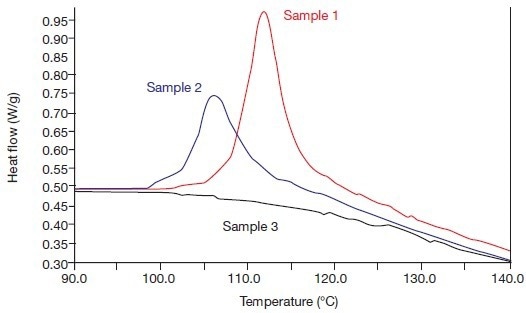
Figure 4A. The alpha phase fusion effects of the systems 1, 2, and 3 (in 1993), i.e., heating rate 20 °C/min. Image Credit: PerkinElmer
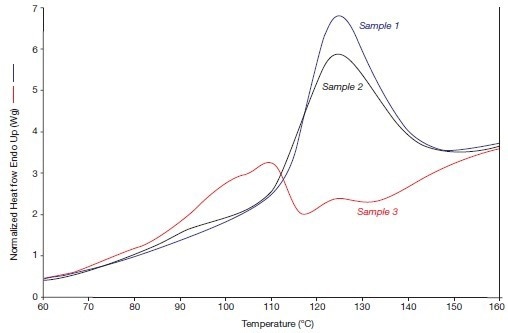
Figure 4B. The alpha phase fusion effects of the systems 1, 2, and 3 (in 2005), i.e., heating rate 300 °C/min. Image Credit: PerkinElmer
The two annealed samples (1 and 2) have stronger crystal transitions than before, while the non-annealed reference sample 3 is now also displaying a distinct crystal transition. As a result, due to the release of internal tension during the compression molding process, the beta crystallinity of this sample has partially transformed into alpha crystallinity during its lengthy storage at 20 °C.
To verify the consistency of all fusion effects measured, the recrystallization effects during the fusion of samples 2 and 3 (1993) needed to be corrected.
It was soon apparent that particularly high coupling between the alpha/beta fusion effects provided opportunities for correction.
Presented as a function of Hf were the Hf1 values of the four additional samples. The extrapolation of the linear relationship that best fits these data resulted in Hf* = 0.0 and a Hf1 value of 112.8 J/g.
The Hf1 value for Hf* = 0.0, which yields the maximum correlation factor value, was then found by changing this value of 112.8 in small steps between 114.0 and 110.0. The following “optimized” Hf1/Hf* relation was calculated using this value as a “calculated” data point:
| Hf1 = 0.8497 × (Hf*) + 111.89 (n = 5. Rval. = 0.9537) |
(1) |
For sample 3 (1993), replacing Hf* with 0.0 produced a corrected Hf1 value of 111.7 or 112 J/g as opposed to the experimental value of 110.6 J/g. Instead of the experimental value of 119.1 J/g, a corrected Hf1 value of 116 J/g was obtained for sample 2 (1993) when Hf* = 5.1 J/g was substituted.
The corrected Tm1 values for samples 2 and 3 (1993) were determined using the linear relationship Tm1/Hf* in the same manner. Sample 2 (1993)’s corrected Tm1 value was determined to be 251.8 °C. Sample 3 (1993)’s adjusted Tm1 value was determined to be 249.4 °C.
Table 1 also includes a list of these four calculated values with the disclaimer: calculated values.
Calculation of Beta Phase Tm* and Hf1 Values Based on the Alpha Phase Tm* Value.
It is difficult to understand how the Tm1 and Hf1 numbers shown in Table 1 differ from one another. So, an effort was made to compute this data to determine if they fitted into a single model. The model used is simple: assuming that the Tm* values are specified, it uses three derived equations to compute the values of the remaining three parameters, namely the Hf*, Tm1, and Hf1 values:
| Hf* = 0.7200 × (Tm*) – 72.5678 |
(2) |
| Tm1 = 0.4668 × (Hf*) + 249.4099 |
(3) |
| Hf1 = 0.8497 × (Hf*) + 111.7243 |
(4) |
| width |
Tm1 and Tm*: °C
Hf1 and Hf*: J/g and
100 °C < Tm* < 125 °C |
|
It is crucial to understand that these equations only apply to PK copolymer systems that have been compression molded.
The fusion values of its beta crystalline phase were then calculated using the four Tm* values provided in Table 1 along with corresponding experimental Tm* and Hf1 values, see Table 2.
Table 2. Testing the consistency of the results of high and low heating rate DSC experiments performed in 1993 and 2005. Source: PerkinElmer
| Beta Phase Tm1 Values |
| Sample Code |
Tm1 (calc.)°C |
Tm1 (meas.)°C |
| ΔT | °C |
| 1.(1993) |
253.1 |
252 |
1.1 |
| 1.(2005) |
257.3 |
258 |
0.7 |
| 2.(2005) |
257.3 |
257 |
0.3 |
| 3.(2005) |
252.2 |
252.7 |
0.5 |
| |
|
| ΔT | °C average |
0.7 |
| Beta Phase Hf1 Values |
| Sample Code |
Hf1 (calc.) J/g |
Hf1 (meas.) J/g |
| ΔHf | J/g |
| 1.(1993) |
118.5 |
116.1 |
2.4 |
| 1.(2005) |
126.2 |
126.9 |
0.7 |
| 2.(2005) |
126 |
126.1 |
0.1 |
| 3.(2005) |
116.8 |
118.2 |
1.5 |
| |
|
| ΔT | °C average |
1.2 |
The comparison of the calculated values with the reported measured values is satisfactory. It suggests that the measured variations in Tm1 and Hf1 of the two crucial characteristics are accurate.
To learn more about this unique behavior, further research must be carried out. But in reality, the following findings were made using experimental data:
- Vary by more than twelve years in time
- Measured by various individuals in various regions
- Carried out on various DSC systems
This data proves the superb quality, great stability, and dependability of PerkinElmer’s Thermal Analysis Systems.
The Glass-Rubber Transition
For the majority of systems, it is either impossible or very challenging to determine the Tg value of high crystalline polymers using DSC. In the past, attempts to use traditional DSC to calculate the Tg values of PK co- and terpolymers were reported.
The ensuing conclusion was that only after a suitable thermal pre-treatment on PK terpolymers could the DSC Tg value of PK co- and terpolymers be determined. For these systems, a DSC Tg (onset) value of 4 °C ±3 °C was reported.3
To check for a Tg effect, the heat flow/temperature curves of the three current samples were magnified. For systems 1 and 3 (2005), a distinct Tg impact was seen; see Figure 5. System 2 (2005) only recognized the Tg onset.
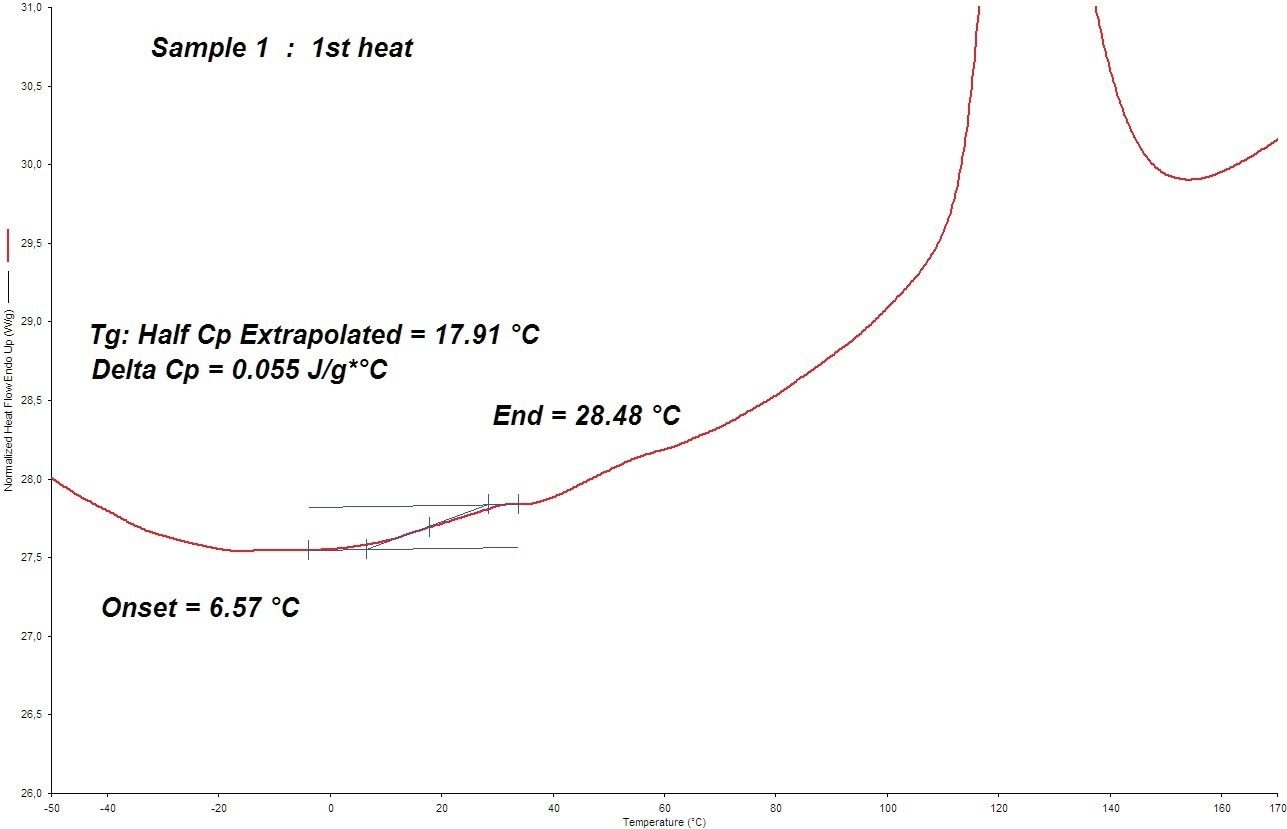
Figure 5. The DSC Tg value determination of sample 1 at 300 °C/min (in 2005). Image Credit: PerkinElmer
The following was discovered:
- (2005) DSC Tg (onset) = 7 °C
- (2005) DSC Tg (onset) = 2 °C
- (2005) DSC Tg (onset) = 9 °C
This outcome surpasses every benchmark ever measured for semi-crystalline polymers. It is assumed that careful adjustment of the sample bulk, shape, and pre-treatment3 will further enhance these results.
Summary and Conclusions
More information on the amorphous and crystalline phases of this high crystalline polymer was obtained from two simple HyperDSC heating scans on three PK copolymer samples than from several previous conventional DSC heating rate studies.
The alpha- and beta-phase fusion effects were assessed without any hindrance owing to recrystallization effects during either process, and the stated highest Tm1 value, i.e., 258 °C, was invalidated by the high heating rate measurements (300 °C/minute).
The results of the latest high-rate measurements and the previous low-rate measurements are entirely compatible with the recommended alpha/beta fusion paradigm. Furthermore, Tg effects were clearly seen in these scans even without any prior treatment (this is rare for such high crystalline polymers).
Based on the findings of these measurements, it can be concluded that the HyperDSC approach is currently the most efficient and sensitive DSC method for characterizing both the crystalline and amorphous phases of polymeric systems.
References
- E. Drent, European Patent 121,96 (Shell), 1984.
- B.J. Lommerts et al., J. of Pol. Sc.: Part B: Polymer Physics, Vol. 31, p. 1319 – 1330 (1993).
- W.M. Groenewoud: Characterization of Polymers by Thermal Analysis, Elsevier Science Amsterdam/New York, ISBN:0-444-50604-7 (2001).

This information has been sourced, reviewed and adapted from materials provided by PerkinElmer.
For more information on this source, please visit PerkinElmer.