Sponsored by PerkinElmerReviewed by Maria OsipovaAug 30 2022
Synthetic polymers are employed in a wide range of industries, including food, automotive, and packaging, for a variety of applications. The caliber of the polymers or polymer blends utilized during production determines the caliber of plastic products.
Therefore, it is essential for raw material identification, material characterization, and other quality assurance tests to be done during every stage of the manufacturing process to ensure consistent batch-to-batch high-quality materials.
One of the thermal analysis techniques used to analyze a wide range of materials is thermogravimetric analysis (TGA). In addition to DSC, the most popular thermal technique, TGA offers complementary characterization data.
In a controlled environment, TGA measures the quantity and rate (velocity) of change in the mass of a sample as a function of temperature or time. The measurements are generally utilized to ascertain the compositional characteristics of the materials as well as their thermal and/or oxidative stabilities.
The method can examine materials that experience mass loss or gain as a result of oxidation, decomposition, or volatiles loss (such as moisture). It is particularly helpful for researching polymeric materials, such as films, fibers, thermosets, elastomers, composites, coatings, and paints.
TGA measurements offer useful data that can be used to decide which materials to utilize for certain end-use applications, estimate product performance, and improve the product’s quality. The following sorts of measurements benefit most from the technique:
- Oxidative stabilities
- Decomposition kinetics
- Filler content of materials
- Compositional analysis of multi-component materials or blends
- Estimation of product lifetimes
- Effects of reactive atmospheres on materials
- Moisture and volatiles content
- Thermal stabilities
PerkinElmer provides a range of high-performance TGA instruments to meet a variety of operational needs and application needs. Modern autosamplers are an optional feature on all TGA instruments for dependable, unattended operation. All PerkinElmer TGAs can also be modified for evolved gas analysis using FT-IR, MS, or GC/MS.
These examples highlight the PerkinElmer TGA’s expanded capabilities as a useful tool for polymeric characterization and quality assurance.
Thermal Stabilities and Moisture Content
The TGA results produced on nylon 6,6 toothbrush bristles are displayed in Figure 1. The graph displays the percent mass for the nylon 6,6 bristles under a nitrogen purge as a function of sample temperature. The PerkinElmer TGA heated the sample, which was around 10 mg, at a rate of 20 °C/minute.
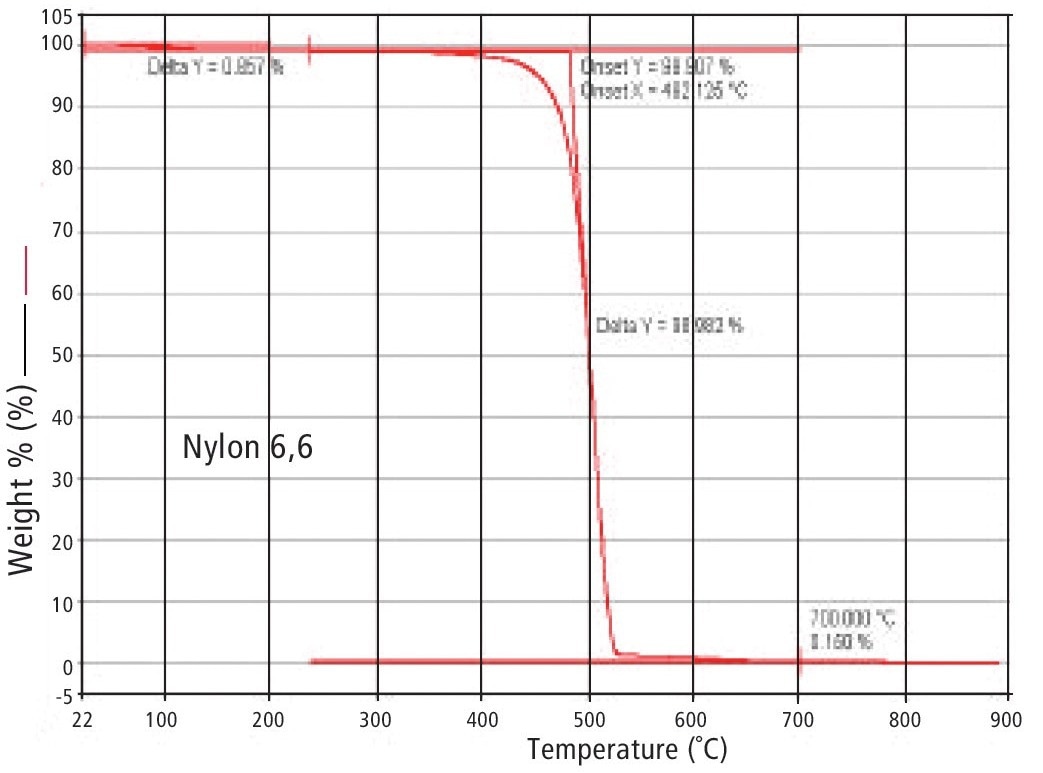
Figure 1. TGA results obtained for nylon 6,6 bristles showing thermal degradation. Image Credit: PerkinElmer
According to the TGA measurements, the nylon 6,6 polymer experiences thermal degradation starting at 482 °C and a 99.0% overall mass loss. A negligible amount of inert residue (0.15%) is still present.
TGA can be used to measure the little amount of ambient moisture that nylon polymers absorb. This can be seen in Figure 2, which shows an expanded view of the TGA results in the temperature range below the commencement of degradation for the nylon 6,6 sample.
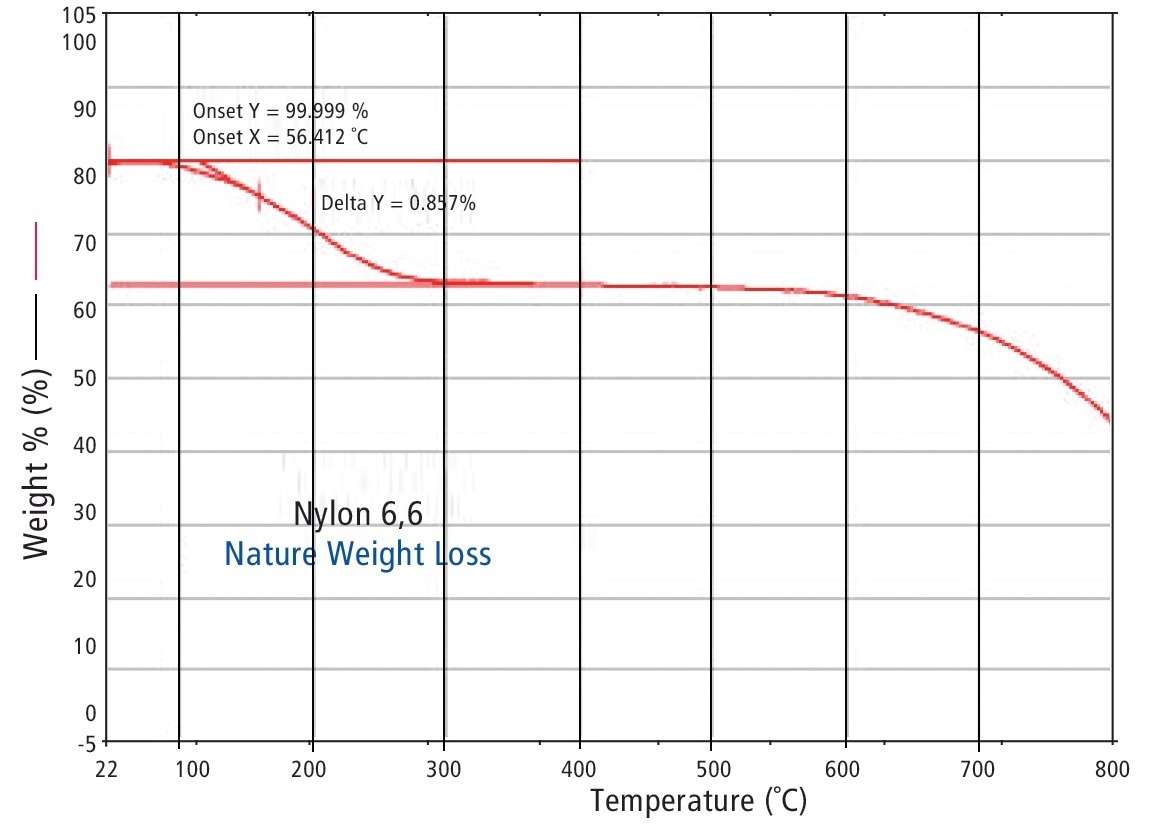
Figure 2. TGA results water wright loss for nylon 6,6. Image Credit: PerkinElmer
The nylon polymer begins to evolve a small amount of moisture at around 56 °C; TGA measurements show that this amount is 0.86%. To find this trace amount of moisture content, high-performance TGA equipment is required. Recognizing this moisture content is essential since it significantly affects the end-use properties and processing capabilities of nylon.
Filler Content in Polymers
The assessment of the filler content in composites and polymers is a significant application of TGA. The level of fillers can significantly affect the final product’s end-use properties (thermal expansion, stiffness, and damping).
This is crucial for electronics applications since the amount of filler has an impact on the coefficient of thermal expansion (CTE), which is calculated using the TMA.
A printed circuit board’s components need to have relatively similar expansivities to prevent the accumulation of strains. The amount of filler is measured using TGA because it is one of the factors that could affect variations in thermal expansion. Figure 3 shows the TGA results produced on a glass-filled epoxy resin that is employed in electronic applications.
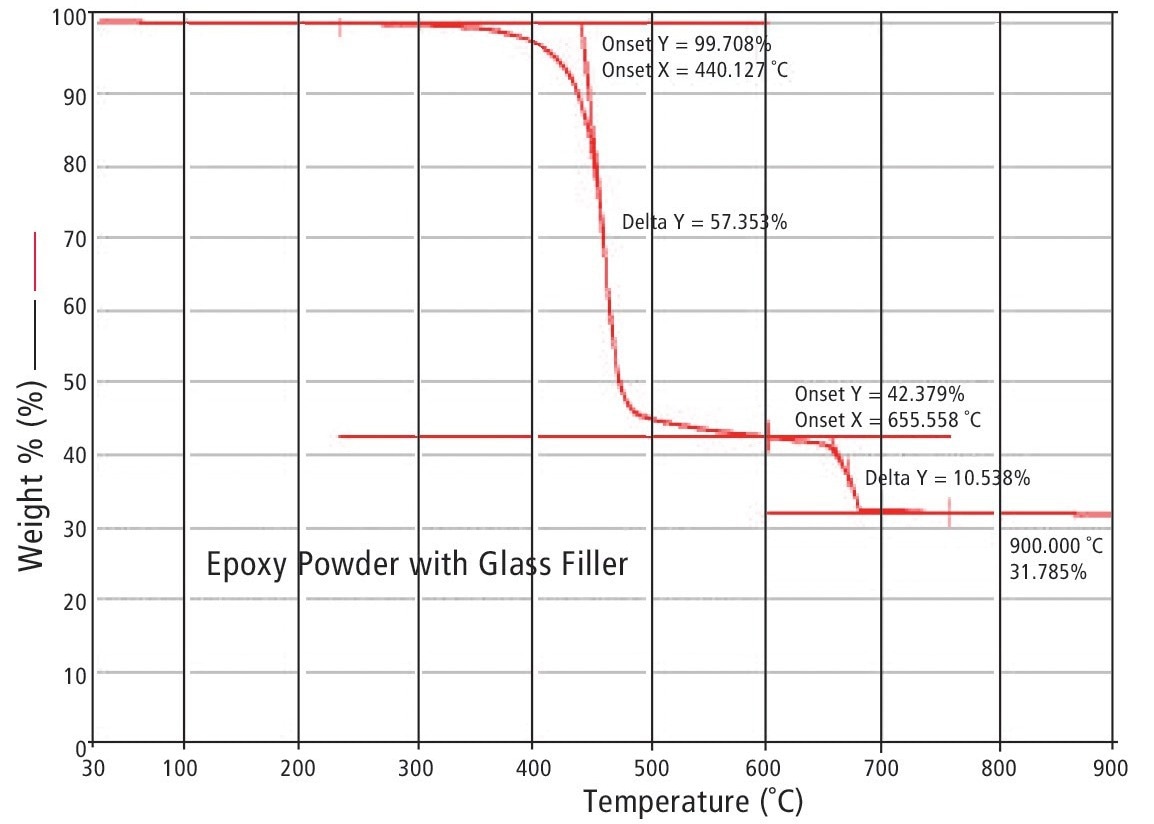
Figure 3. TGA results for epoxy-glass powder. Image Credit: PerkinElmer
Thermal degradation of the epoxy resin begins at 440 °C and results in a mass loss of 57.4%. The sample’s purge gas was automatically switched to oxygen at 650 °C, and the carbon residue was burnt off at 655 °C with a 10.5% mass loss.
[Automated gas flow and gas switching accessories are available with all PerkinElmer TGA instruments to make it easier to conduct TGA thermo-oxidative investigations]. The inert glass filler, which the TGA reveals makes up 31.8% of the mass of the epoxy resin, is what is left over after the sample is exposed to oxygen.
Characterization of the Differences in Polymers
The detection of minute, but potentially significant, changes between polymers is possible using a high-performance TGA, such as those offered by PerkinElmer. The TGA results from two distinct high-density polyethylene (HDPE) containers are displayed in Figure 4.
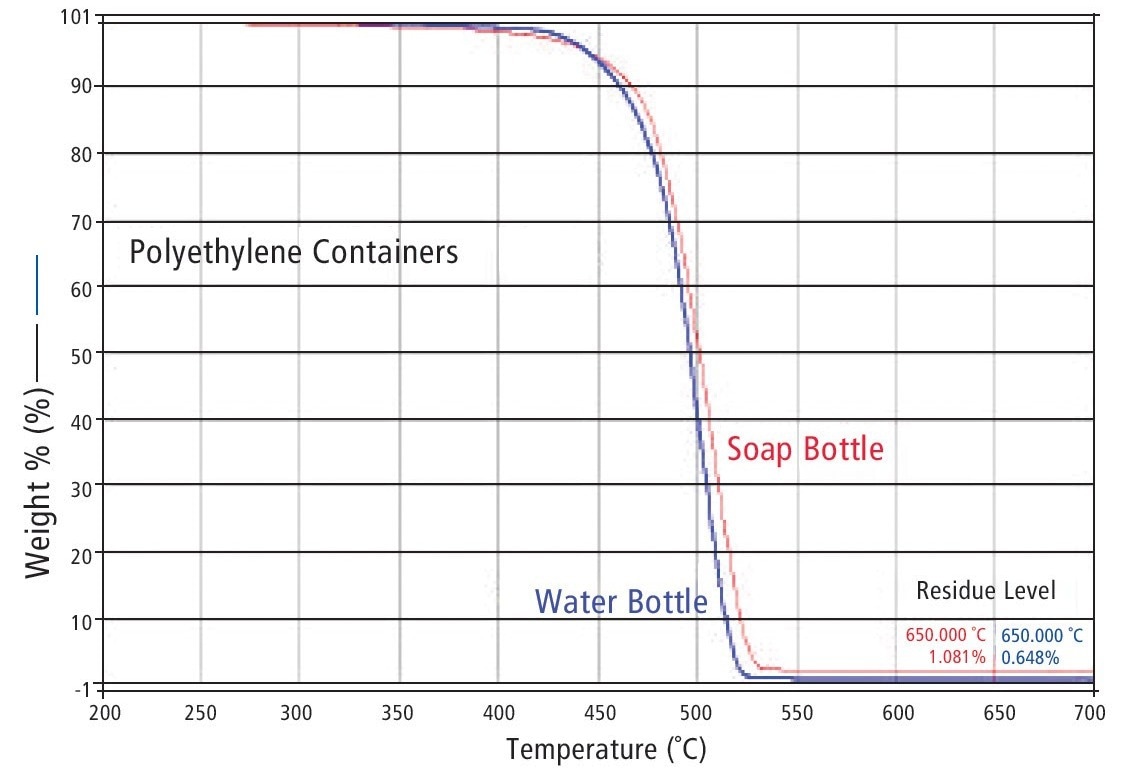
Figure 4. TGA degradation for two different HDPE bottles. Image Credit: PerkinElmer
The first is a clear water bottle, and the second is an opaque soap container. The HDPE resin used in the soap bottle contains slightly more filler (2.1% vs. 0.65%) but less filler overall. For the creation of the containers, this information is crucial.
Compositional Analysis of Multi-Component Polymers
The evaluation of the compositional analysis of polymeric blends is one of the most significant applications of TGA. The use of Auto Stepwise TGA, in which the TGA instrument automatically heats the sample and then retains it at isothermal conditions when the instrument detects a considerable weight loss, can improve the compositional characterization information.
As a result, overlapping decomposition events are separated as far as they can be, allowing for the most precise compositional characterization of polymers.
The characterization of ABS serves as an illustration of how the Auto Stepwise technique might deliver valuable compositional information. This polymer alloy consists of butadiene and SAN matrix (styrene acrylonitrile copolymer). Butadiene, a rubbery component, gives the ABS blend the appropriate impact and toughness attributes.
The impact resistance of ABS, which is frequently used for housings for personal computers and other electronic equipment, is crucial for the material’s long-term durability. The butadiene rubber component’s weight transition happens quite near to the SAN copolymer’s decomposition. The two events cannot be distinguished by standard TGA.
Auto Stepwise TGA, on the other hand, does make it possible to address the two weight loss events and conduct a quantitative compositional analysis of the ABS. The Auto Stepwise TGA results on ABS shown in Figure 5 demonstrate this. Excellent characterization data is provided by the clean separation of the butadiene rubber component from the SAN decomposition.
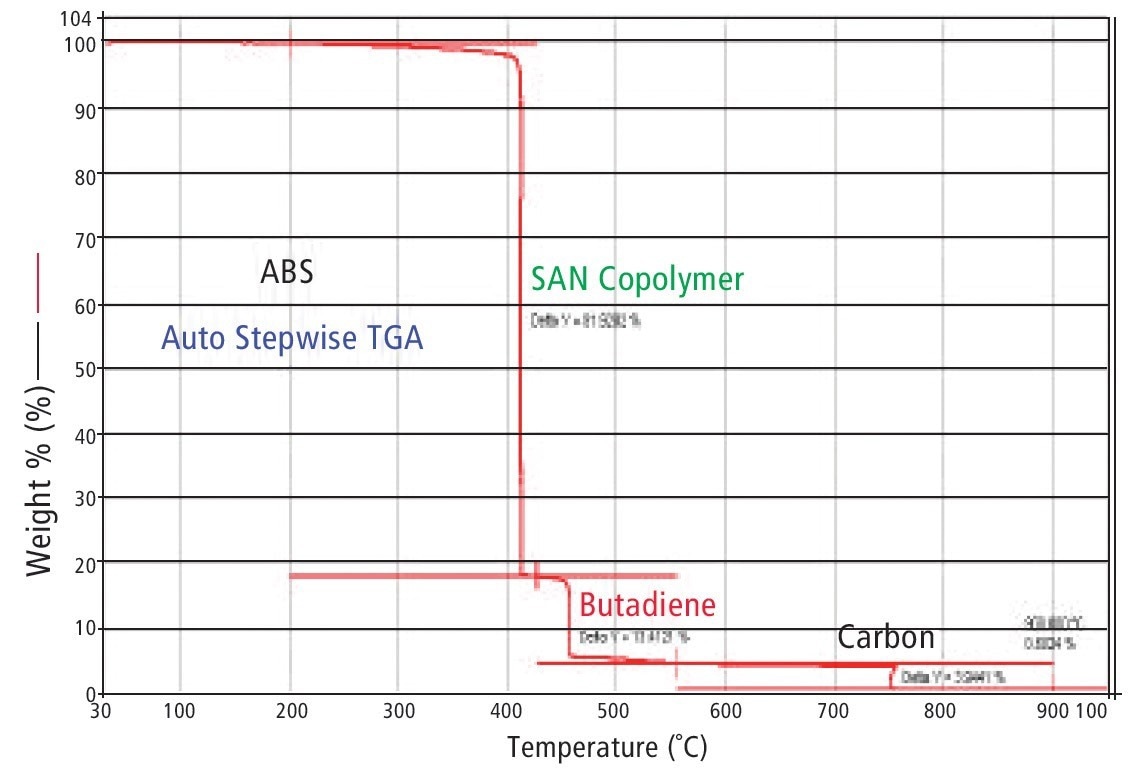
Figure 5. Auto Stepwise TGA results for ABS showing separation of SAN and butadiene components. Image Credit: PerkinElmer
Tire elastomers are another example of how the Auto Stepwise technique can provide excellent separation of overlapping weight loss events. These elastomers are made of a mixture of fillers, carbon black, oil extender, and polymer. Using conventional TGA, it is challenging to distinguish the oil from the polymer since the two events heavily overlap.
However, as demonstrated in Figure 6, the Auto Stepwise method enables the precise identification of every part of a tire elastomer. The development of an automotive tire with the desired long-term qualities will benefit from this information.
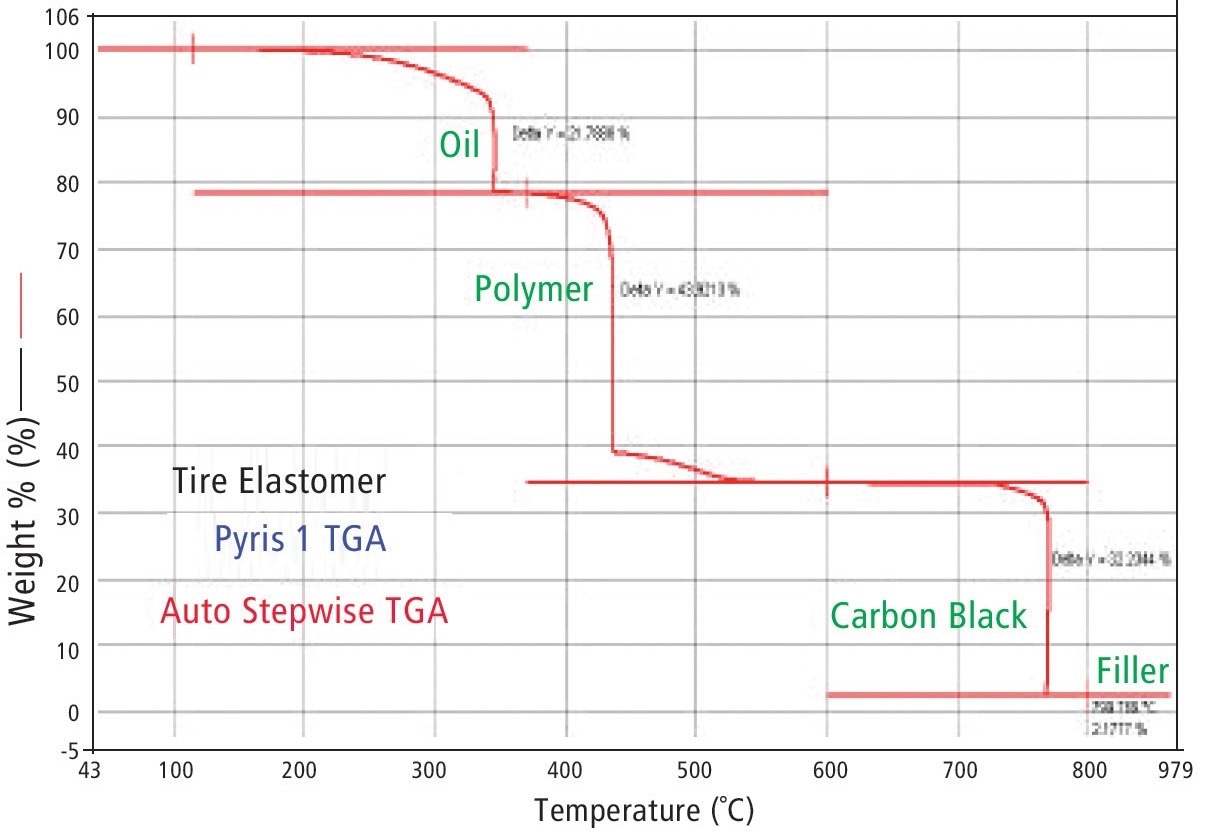
Figure 6. Auto Stepwise TGA compositional results for tire elastomer showing separation of oil, polymer, carbon black and filler. Image Credit: PerkinElmer
Measurement of Low Level of Volatiles
Low level volatilization can have a significant impact on many polymer applications. Even a small number of volatiles (less than 1%) can have a significant effect on how the polymer is processed when produced in huge quantities.
Low volatile concentrations are known to have an impact on polymer processing during injection molding or blow molding. The low amount of volatilization attained for a single PET resin pellet is displayed in Figure 7.
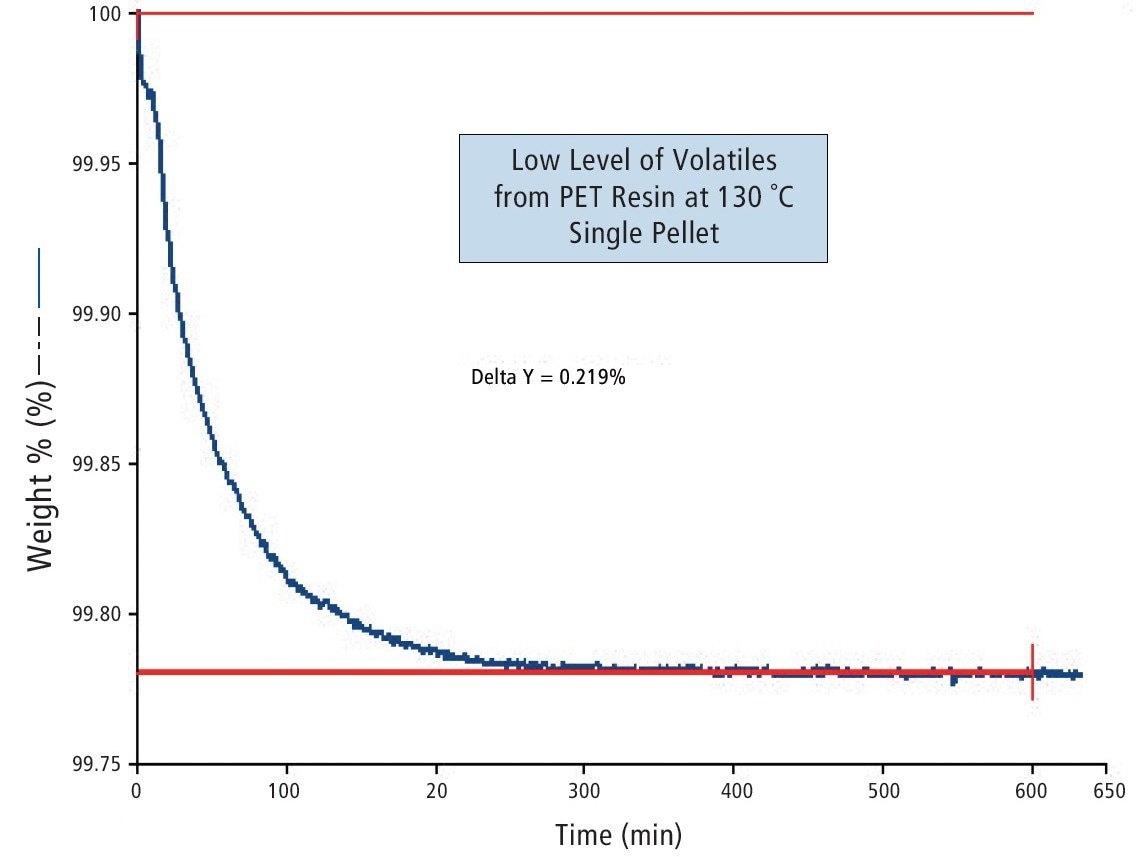
Figure 7. Low level emission of volatiles from single PET chip under gentle isothermal conditions at 130˚C. Image Credit: PerkinElmer
The sample was held for this experiment while it was slightly isothermal at 130 °C. The PET pellet saw a mass loss of 0.219% after 10 hours. Low concentrations of soluble volatile components can alter the flavor of the beverage; hence this is a crucial consideration for PET resins used to produce beverage containers.
These long-term observations are made feasible by the high-performance TGA instruments from PerkinElmer, which offer a high level of sensitivity and stability.
TGA Decomposition Kinetics for Lifetime Predictions
Some polymeric materials, such as coatings for electrical or communications cables, can have their effective product lifetimes estimated using TGA decomposition data. Three or more distinct heating rates are applied to the sample.
The duration of the decomposition event is altered by the employment of various heating methods. The indicated decomposition temperature rises as the applied heating rate increases. This method establishes a relationship between temperature and time for the decomposition of polymers, and this knowledge can be utilized to model the kinetics of decomposition.
The TGA results from a sample of polyethylene heated at speeds ranging from 1 to 40 °C/minutre are displayed in Figure 8. Decomposition begins at higher temperatures as the heating rate is raised.
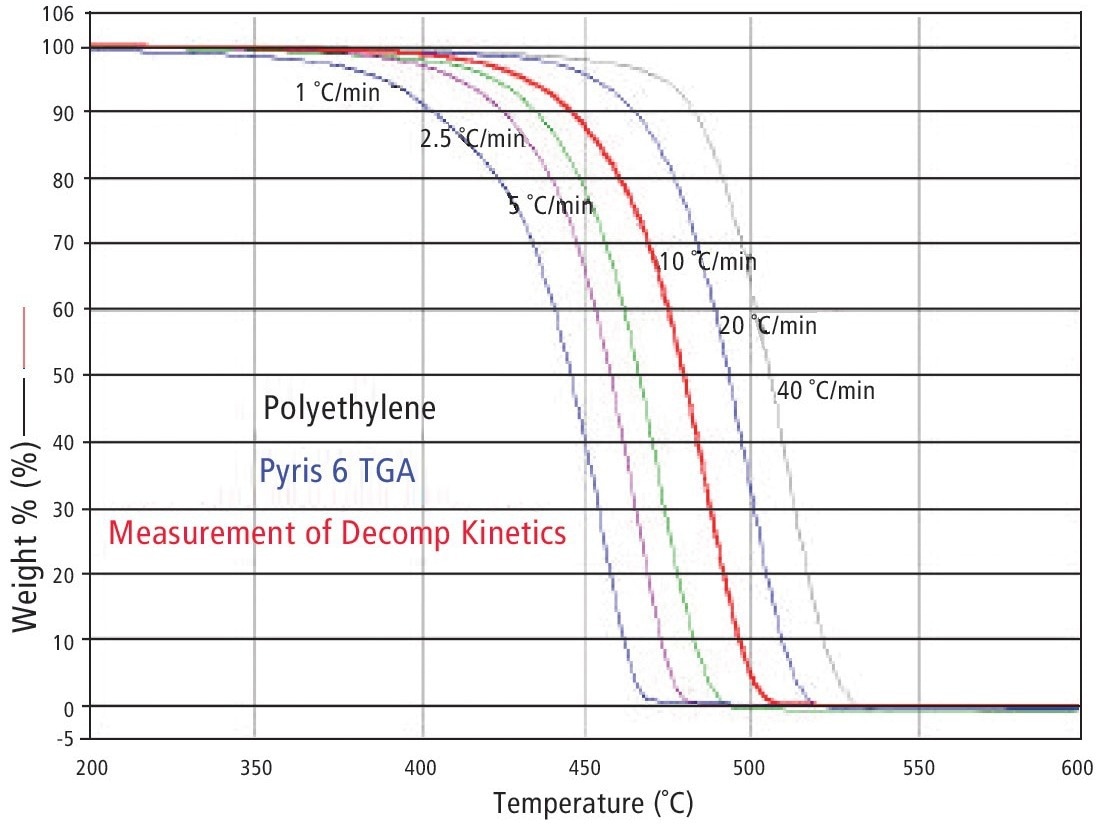
Figure 8. Effect of heating heat on the thermal decomposition of polyethylene. Image Credit: PerkinElmer
The TGA Decomposition Kinetics Software from PerkinElmer can then be used to analyze this data. The software’s kinetics analysis gives useful prognostic data on polymeric materials, including lifetime predictions.
The isoconversion curves, which indicate the time to reach a specific level of conversion as a function of temperature, are shown in Figure 9. These are very helpful for evaluating product lifetime.
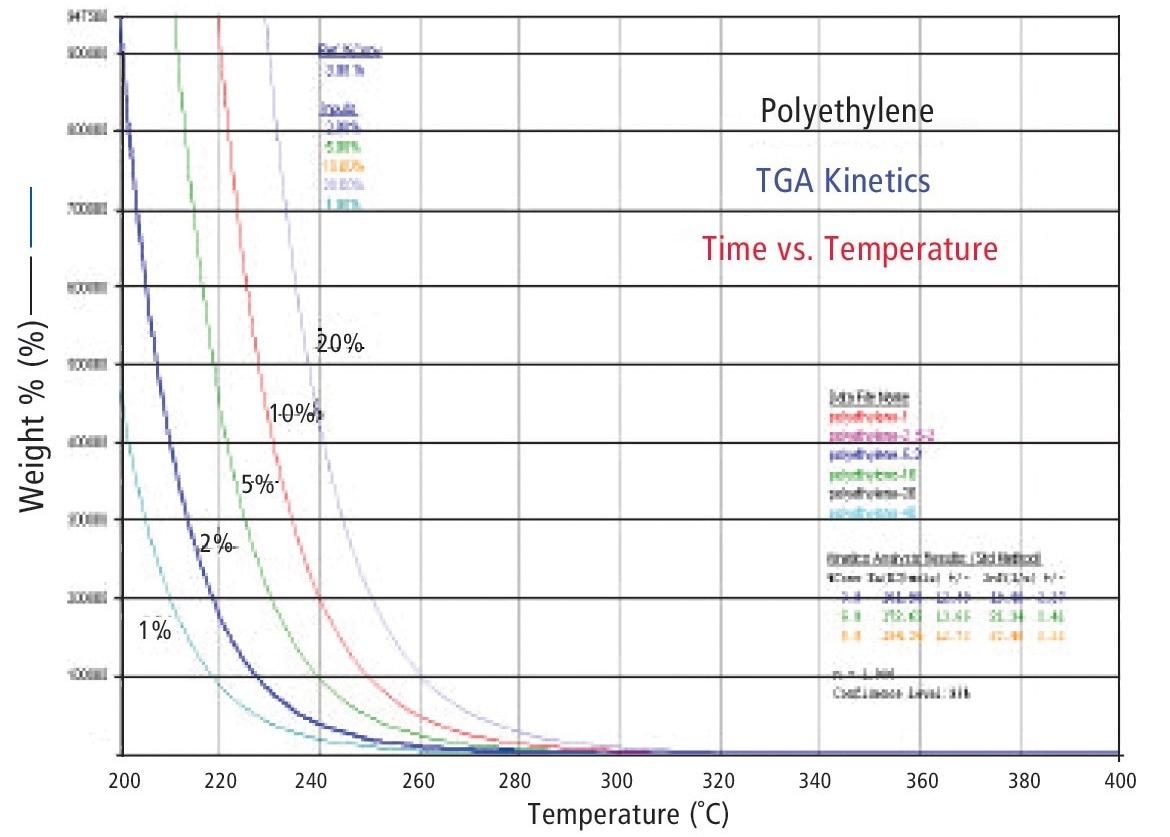
Figure 9. Isoconversion curves for polyethylene thermal degradation based on kinetics modeling. Image Credit: PerkinElmer
It is possible to estimate how long it will take to reach the necessary level of critical conversion at a specific operating or end-use temperature if the desired level of critical conversion is known.

This information has been sourced, reviewed and adapted from materials provided by PerkinElmer.
For more information on this source, please visit PerkinElmer.