The form of orthopedic implants can broadly vary. These variations can occur in terms of size (from millimeters to tens of centimeters), shape (from complex saddle-shaped knee prostheses to simple spherical femoral heads), material (from hydroxyapatite to stainless steel), and surface finish (from intricately textured to promote stability to super smooth for reduced friction).
Controlling the critical specifications of a part can become rather challenging when such a wide range of parameters need to be considered. Many different metrology instruments must be involved as they suit different tasks.
Tolerances on measured parameters are also often exceedingly tight with deference to a component’s functionality and longevity after its successful surgical implantation. Advanced optical profilometry provides several advantages for research, development, and quality control for the manufacturing of orthopedic implants.
Non-contact and non-destructive characterization, quick and accurate areal measurements, an extensive dynamic range to measure both very rough and very smooth surfaces, an insensitivity to material type, and the capability for complete automation to measure a batch of parts and to perform pass-fail summaries based on user-specified parameters are some of the benefits offered by Bruker’s white light interferometry (WLI) technique.
The Need for Surface Texture and Roughness Metrology
High surface and volume specifications under stringent normative regulations (e.g., ISO 7206, ASTM F2033, ASTM F2068, ASTM F2791, etc.) are used to precision manufacture orthopedic parts. Patient health is the main reason for the industry’s strict adherence to part specifications. If a device is implemented with even one defective component, dire ramifications can occur.
If there is any uncertainty over a component’s interaction with the patient’s body, the device may be prohibited from working as designed or can even cause future complications. Such complications can range from patient discomfort to the need for further treatments and surgeries or even death.
Ultimately, a recall of a defective product is something manufacturers strive to avoid, as this typically incurs a loss of reputation among the medical community and the general population and a heavy financial burden.
The current volume of manufacturing combined with high yield expectations has resulted in a requirement for in-depth integration of metrology with production processes, in addition to these critical “downstream” reasons for part inspection.
For example, specification deviation or an incorrect polishing process could be helped by monitoring average surface roughness. This information can be fed back to allow for the re-optimization of upstream tools, resulting in less raw material waste and fewer bad parts being produced. This is a clear example of the manufacturer’s return on investment (ROI).
It is imperative that orthopedic parts, for all the reasons above, are inspected in an accurate, fast, non-destructive, and replicable manner. For quality control (QC) in the orthopedic industry, roughness and surface roughness are the main criteria.
Bruker’s WLI-Based Profilometry: Advantages
Bruker’s WLI-based 3D optical profilers have provided the industry with unique performance advantages for roughness characterization, on top of delivering the obvious benefits of non-contact profiling that are mandatory for most of the final control in orthopedic manufacturing.
Illuminating the sample/part surface with white light through an interferometric objective is the basic principle behind these systems, which directly provides sub-nanometer vertical metrology capability independent from the magnification of the objective in use.
The effective measurement of shiny or dark surfaces is facilitated by this approach, as it is also immune from surface reflectivity or color.
As with the majority of optical microscopes, WLI profiling visualizes a full field of view of a couple of millimeters square at low magnification while reaching a sub-micron lateral resolution at higher magnifications. More relevant statistical data is ensured by getting full areal measurements, reducing the likelihood of missing critical defective areas, as Figure 1 illustrates.
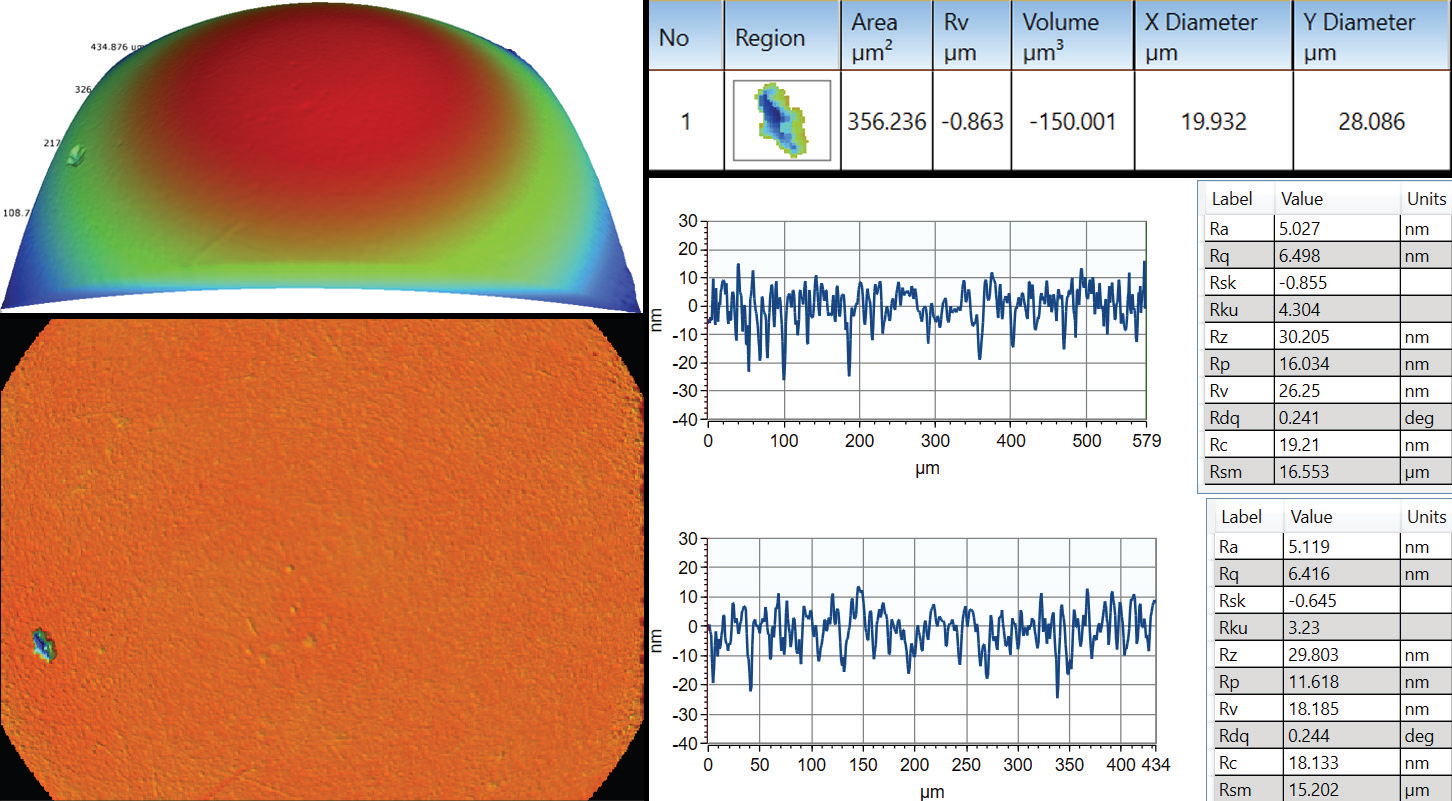
Figure 1. Where a few single traces on a hip ball cannot properly identify the pit defect, areal measurement allows automatic defect detection and characterization of its severity. Image Credit: Bruker Nano Surfaces and Metrology
When combined with the ability to automate the measurement, these advantages mean that this type of WLI profiler is the best choice for the assessment of the roughness quality in the final finishing steps of polishing a hip ball with a mean roughness well below 10 nm or on a carbon-reinforced PEEK hip cup.
High-lateral-resolution mapping of the surface topography that complies with areal roughness standard ISO 25178 and surface finish requirements from ISO 7206-2 (see Figure 2) is provided by the WLI approach.
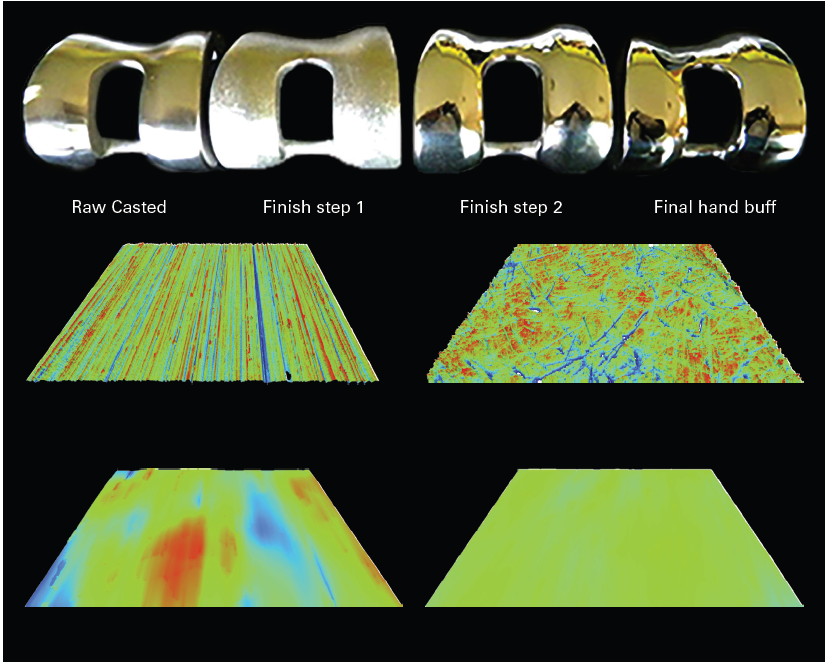
Figure 2. (Top, from left to right) Raw casted, initial and final finish steps. (Bottom) Associated topographies with same vertical and horizontal scales: XY=1.6*1.2 mm², Z=[-2 μm; +2 μm]. Image Credit: Bruker Nano Surfaces and Metrology
The combination of high throughput and the ability to operate with long-working-distance objectives is one of the lesser-known benefits of Bruker optical profilers’ implementation of WLI.
The imaging array and multiple data sets captured in a single vertical scan are linked to the high throughput. Including auto-focusing on the surface, measurement cycles can be as fast as a couple of seconds for 100% inspection.
Finally, these WLI profilers decouple vertical resolution from the objective magnification, contrary to any other optical technology, which leads to the ultimate sub-nanometer vertical resolution for all objectives (see Figure 3).
By designing super-long-working-distance (SLWD) objectives that expand the capability for users to access curved hip cup surfaces or the sides of knee joints, Bruker further enhances this unique benefit. This is advanced further by the large swivel-head feature of the NPFLEX optical profiler.
Through Bruker’s unique SLWD objectives and the ±45° large swivel scan head feature of the NPFLEX WLI profiler system, versatile access to complex parts without compromised vertical resolution is enabled.
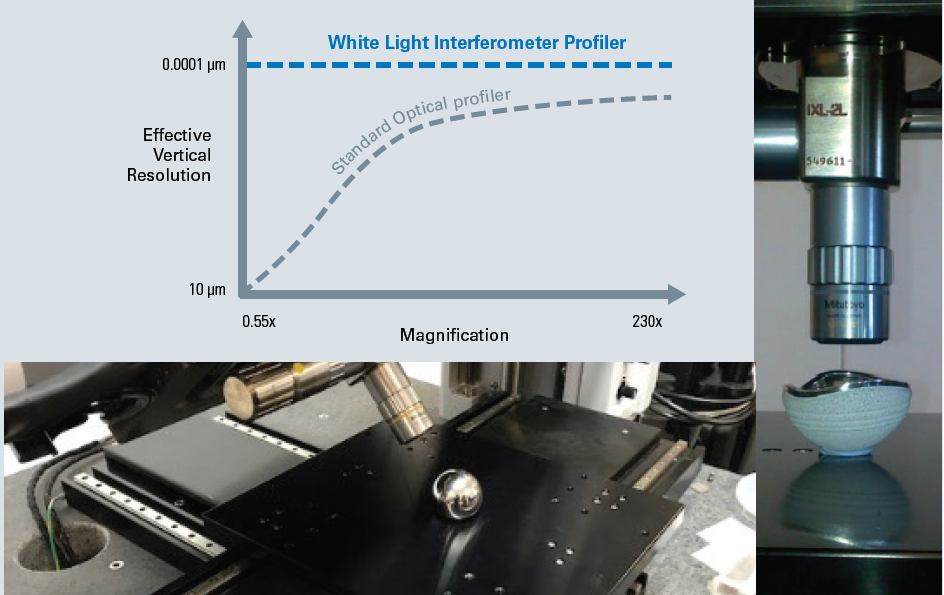
Figure 3. Versatile access to complex parts without compromised vertical resolution is enabled through Bruker’s unique SLWD objectives and the ±45° large swivel scan head feature of the NPFLEX WLI profiler system. Image Credit: Bruker Nano Surfaces and Metrology
Quality Control - Automated Hip Cup Inspection
To provide rigid-body for metrology stability, precise quality control of roughness with built-in vibration isolation, crash mitigation systems, multiple sample-fixturing options, and super-long-working-distance objectives to collect data from difficult-to-access areas, Bruker’s NPFLEX and ContourX WLI profilers are specifically designed for production floors.
By ensuring self-calibration at all times and improving profiler-to-profiler matching at the same or different factory locations, optional internal laser calibration can further aid reliable metrology. Where metrology traceability is part of quality standards, the ability to flag when a profiler is out of calibration is critical for medical parts.
These systems also feature a dedicated production interface, which is completely separate from the standard interface.
Specifically designed to allow easy programming of measurement routines, the production interface is built off a standard generic production flow: the operator loads the part, the instrument recognizes the part through lot or part ID and makes pre-determined measurements, pass-fail results are reported, and prompts for next batch are displayed (see Figure 4).
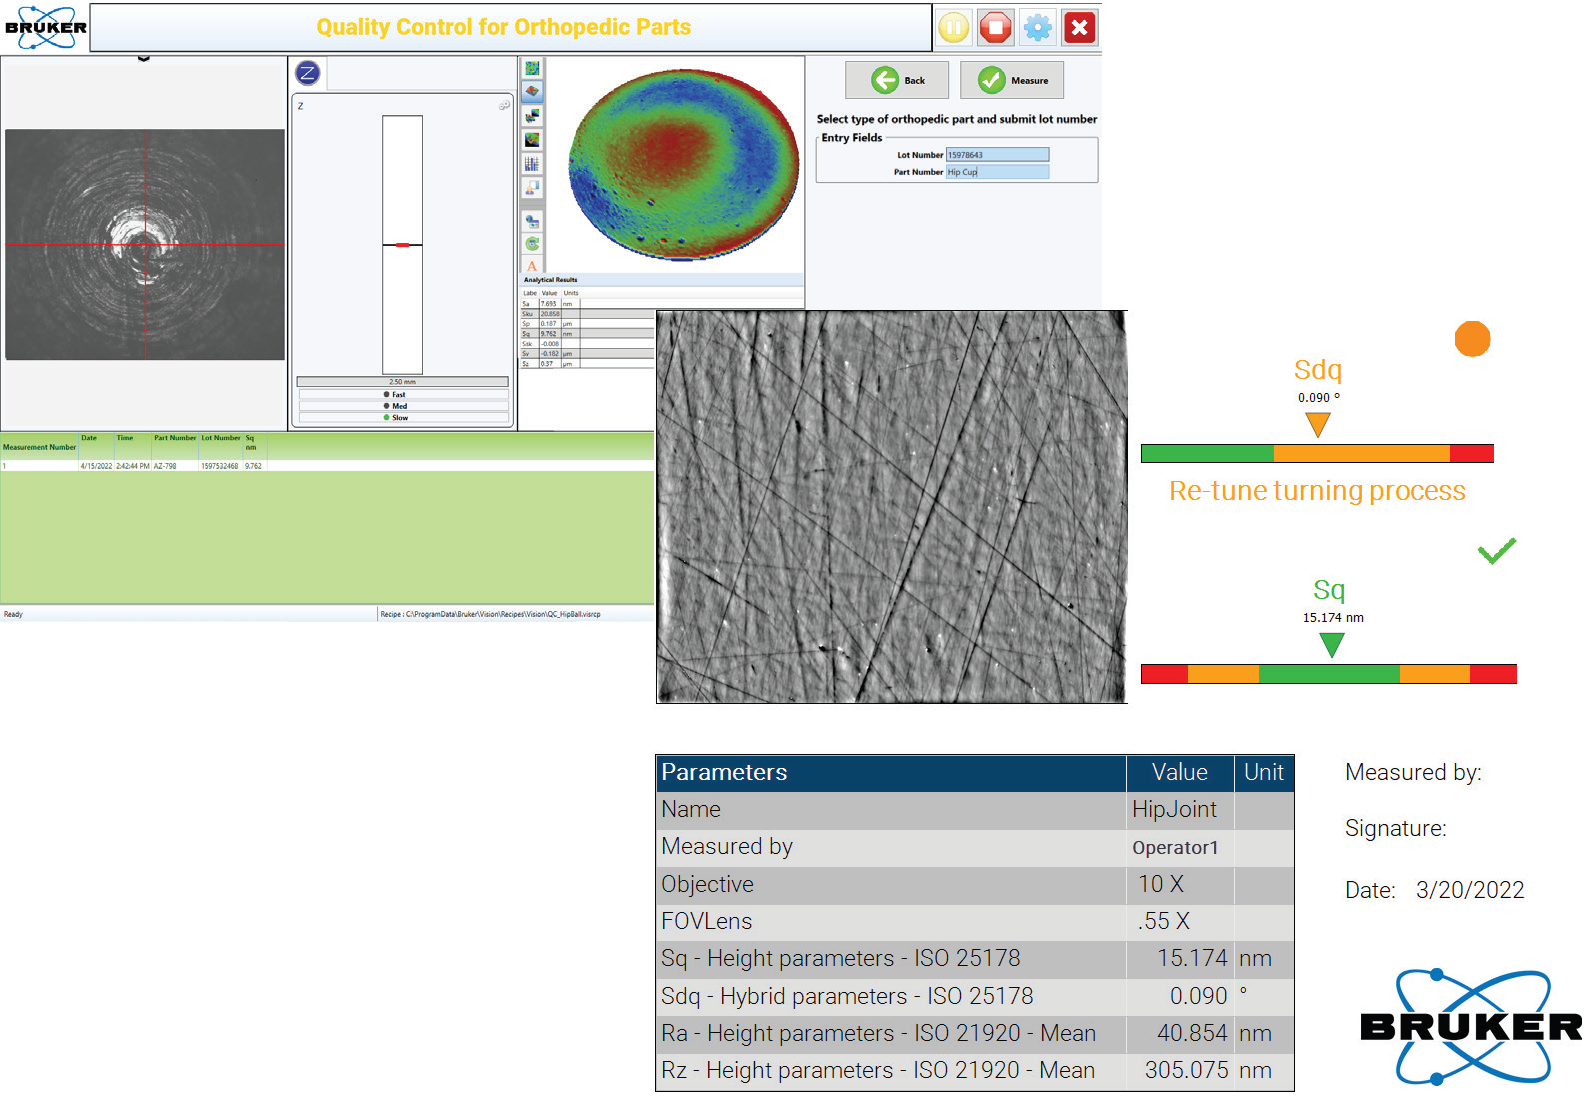
Figure 4. Advanced Production Interface and an example of automatic report generation. Image Credit: Bruker Nano Surfaces and Metrology
Ease-of-use features, such as barcode scanning, can be easily implemented to enable keyboard-free measurements, and minimal knowledge is required on the ’operator’s part. By specifying authorized operator via user-ID input, barcode reading can also help in setting up access control.
Meanwhile, a security password locks the standard interface. This code only grants access to the quality engineer so that they can build specific recipes or run/access certain functionalities (e.g., profiler calibrations).
For instance, a process to measure the concave surface of hip cups could easily be made. Typically, the hip cup would be placed in a fixture or mounted on the instrument to ensure the part is rigidly and correctly oriented during measurement. The part number of that cup would then be scanned or entered to access the associated measurement routine.
Next, the instrument uses a motorized X-Y sample stage to move the hip cup laterally to the point of measurement: lowering the objective toward the hip cup until the central interior surface is focused. All of this is performed without the need for user intervention.
Automatic taking and processing of the full field-of-view topography is enabled, which means that a best-fit sphere is removed from the data, and filtering is applied in accordance with areal (ISO 25178) or profile (ISO21920, ASME B46.1) roughness standards.
The final stage is when the roughness parameter is compared to the tolerance for that part, and it is passed or failed. A full report can be printed or automatically saved using the part number as the filename.
A single measurement can take less than 30 seconds, from scanning the part barcode to pass or fail determination. It is an efficient process that allows large volumes of parts to be measured without holding up downstream processes.
An example of automatic report generation is Advanced Production Interface.
Since a direct result provides the necessary channels to combine with high-end automation, more advanced processes can incorporate robots to load parts, such as Industry 4.0, by using third-party software to provide TCP/IP-level commands for acquisition control and generic Comma Separated Variable (.csv) file output for results.
Figure 5 shows the comprehensive interaction channels. Vision64 software enables recipe transfer between multiple Bruker WLI profilers and external interaction, which supports the export and import function for the seamless spread of newly built recipes. Through automatic light adjustment, it also sustains reproducible measurement conditions via pre-intensity calibration or fixture alignment, which accounts for any XY position offset.
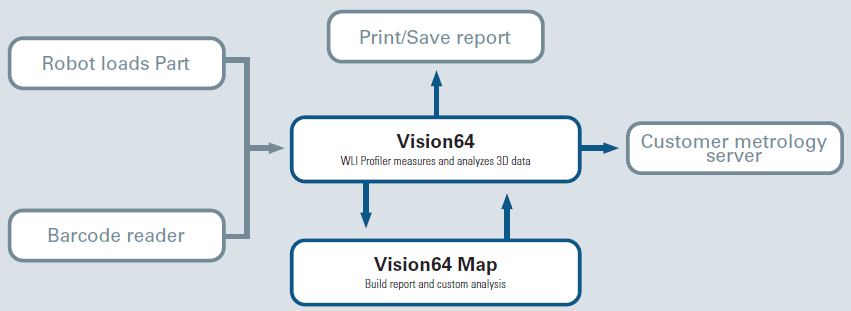
Figure 5. Schematic of the integration between external devices and the Bruker measurement system. Image Credit: Bruker Nano Surfaces and Metrology
Designing Future Orthopedic Components: Research and Development
Shop floor and research laboratory settings imply different samples, users, and usages. Within the research laboratory, speed and throughput is not a key requirement. With added importance placed upon flexibility, regardless of settings, repeatability and utmost accuracy are still imperative.
The sample is a known quantity in an automated measurement and has definite measurement locations, a regular shape, and known material composition. Based on a property that allows them to perform better than current implant materials, novel materials may be tested in the research laboratory. The type of testing could also be more complex than simple roughness inspection.
The testing could, for instance, determine how the part wears over time. This process could involve testing a newly made part before applying an accelerated aging process to it, remeasuring, and quantifying the difference. Qualifying a particular machining or texturing process that imparts structure to the implant surface to give it advantageous anchoring and long-term rigidity in the body could be another example.
Bruker’s standard software interface and benchtop ContourX optical profilers offer everything that the researcher needs for these types of evaluations - whether smooth and reflective, rough and non-reflective, or even highly transmissive, the combination of high-brightness LEDs for the light source and high numerical aperture interferometric objectives makes obtaining data from various materials simple and straightforward – another benefit of the latest generation of ContourX WLI.
Together with advanced live-signal processing, external illumination also provides the researcher with a unique capability to overlay high-resolution topography with all-in-focus intensity images. This can be done to create better visibility of represented data or further investigate the cross-correlation between reflectivity and potential defects. Revealing slopes and underlying details, the same setup helps navigation through samples using the same interferometric objective.
The easy-to-use interface (VisionXpress™) from Bruker also provides users with flexible and comprehensive control over the optical profiler (as shown in Figure 6). This is particularly important in R&D environments where researchers must deal with a wide range of characterization techniques.
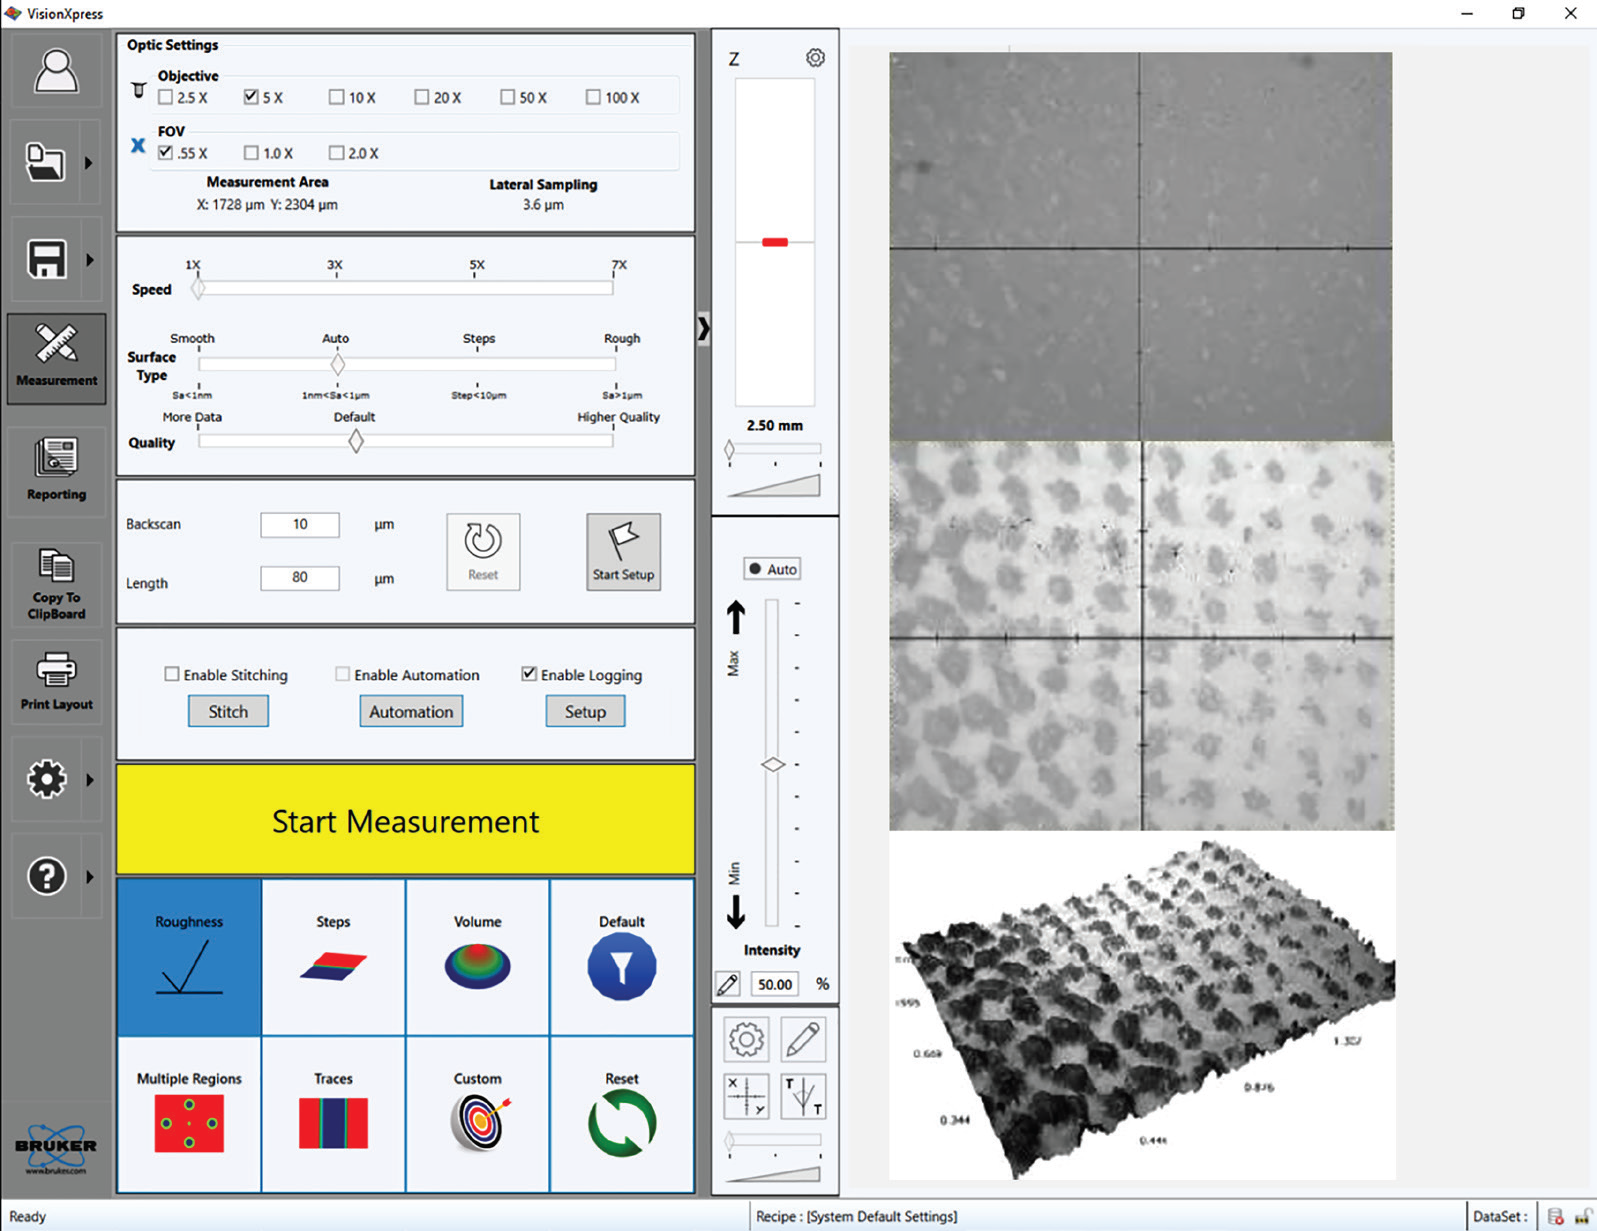
Figure 6. (Left) The VisionXpress interface enables a fast learning curve and flexibility of analysis. (Right, from top to bottom) Live image without external ring illumination, with external ring illumination; and the final 3D representation with an overlay of the all-in-focus intensity image. Image Credit: Bruker Nano Surfaces and Metrology
Finally, it is ensured by Bruker’s unique Universal Scanning Interferometric (USI) mode that the system automatically adapts and selects the best algorithm to ensure accurate results, irrespective of the sample/part surface or operator experience.
The wearing mechanisms to which these implants are particularly prone could be investigated by applying these benefits to the hip cup example from an R&D viewpoint.
With the femoral head in close contact with a liner, each hip cup implant assembly has a shell-like structure connected with an acetabular cup. It is well-known that various combinations of metals, ceramics, and plastics can produce debris and friction, and such debris can result in inflammation of the tissue surrounding the implant.
Osteolysis (bone destruction) and pseudotumors can result from wear and inflammation, and in a few cases, loud frictional squeaking due to ceramic-on-ceramic “stripe wear” patterns can occur.
Careful characterization of both the wear and wear rate for the materials involved is critical to improving the stability and long-term performance of these products in all these cases. Bruker’s 3D optical profilometers are used to attain this type of information.
A sphere made of PEEK (PolyEtherEtherKetone) is shown in Figure 7. PEEK is a thermoplastic possessing mechanical properties and chemical resistance, which have resulted in its adoption in medical implantations as an advanced biomaterial. It is easy to perform before and after wear testing using WLI and Bruker’s profilometer technology to gain valuable insights into how this material would serve as part of a working device.
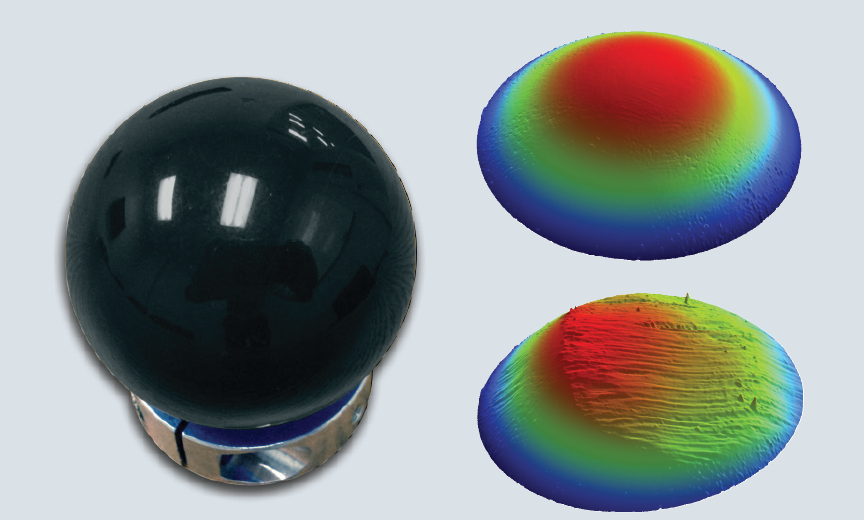
Figure 7. A triptic showing a PEEK (PolyEtherEtherKetone) sphere (left), the surface before wear testing (top right), and the surface after wear testing (bottom right). The images can be analyzed for volume of material lost, among other parameters. Image Credit: Bruker Nano Surfaces and Metrology
Conclusion
Versatile, rapid, non-contact characterization of tribology and surface finish are offered by Bruker’s NPFLEX and ContourX WLI optical profilers. These profiles are ideal for many applications for both the production floor and the research laboratory.
The accurate and repeatable measurements that this technology provides are ideal when it comes to the stringent needs of the orthopedics industry. Often, it is much quicker to obtain the 3D datasets produced than a single-line trace from a contact stylus profilometer, and the 3D datasets typically contain much more statistically significant data for surface characterization.
The capability of these 3D optical profilers to deliver simple, high-throughput, reproducible inspection of hip cups is demonstrated by the specific automation discussed. A highly-accurate wear metrology solution is provided, which is tailored to the medical implant industry.
From design through to manufacture to simulated wearing and aging of products, Bruker’s 3D WLI-based optical profilometry, in summary, offers an excellent metrology solution for the full life cycle of orthopedic implants.

This information has been sourced, reviewed and adapted from materials provided by Bruker Nano Surfaces and Metrology.
For more information on this source, please visit Bruker Nano Surfaces.