Sponsored by MicrotracReviewed by Emily MageeSep 29 2022
Microtrac’s MRB Stabino Zeta (Fig. 1a) measures zeta streaming potential, pH, conductivity, and temperature. Zeta and streaming potential are commonly used to characterize the stability of emulsions, suspensions, and nanoparticles.
A possible measurement method for zeta potential is zeta streaming potential (Stabino zeta method, Fig. 1b), in which the liquid moves and particles are immobilized.
The relative displacement of the ion cloud, measured as a voltage, is then used to calculate the zeta potential, which yields the streaming potential via calibration factors (K). With the second method, called electrophoresis, zeta potential is calculated from the particles’ movement in electrophoretic mobility.
Difficulties such as irreproducibility, chemical, environmental shifts, dilutions, and bubbles can arise from classical electrophoretic measurements.
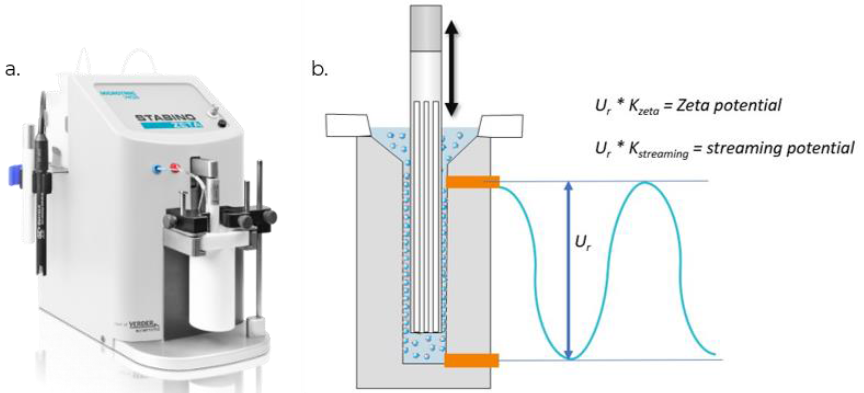
Figure 1. (a). STABINO ZETA and (b) Zeta potential calculated from relative displacement of the ion cloud measured at a voltage, U (streaming potential). Image Credit: Microtrac MRB
Stabino Zeta Features
Titrations
The Stabino Zeta has built-in titration functions where all parameters are simultaneously determined at each dosing step. These titrations include polyelectrolyte titrations to determine charge density, stability, dispersant optimization, and zero point of charge.
They also include salt titrations, where zeta potential is measured as a conductivity function, and pH titrations, which include determining the isoelectric point and stable pH regions. The whole titration or each dosing point can be followed in real-time using the curve progression to include all five measuring parameters.
In Situ Size Distribution
The Stabino Zeta can be combined with the Nanotrac Flex particle analyzer from Microtrac. Its dip-in measuring probe is inserted into Stabino’s Teflon measuring cell. This feature enables determination of size distribution using zeta streaming potential or during charge titration.
Colloidal systems can be evaluated through the formation of agglomerations. In this app note, the combined analysis of zeta potential, particle size characterization, and titration will be described, as well as the determination of the zero point of charge and isoelectric point for cannabis nanoemulsions.
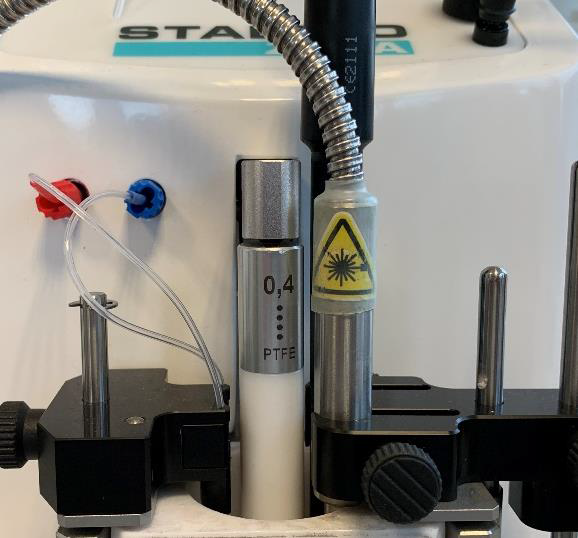
Image Credit: Microtrac MRB
Experiment
Dynamic light scattering and zeta potential were used to characterize CBD nanoemulsions created using a microfluidizer. The creation of the final nanoemulsion with the desired particle size involved five liquid solutions. Analyses of the resulting cannabis nanoemulsions were conducted using the Nanotrac Flex and the Stabino Zeta to determine the surface charge density, stability, size distribution, and zero point of charge.

Image Credit: Microtrac MRB
Results and Discussion
The cannabis industry optimizes the quality of its products based on the particle size of the nanoemulsions due to the strong association between bioaccessibility and particle size. The dosage can be severely affected if the particle size is too coarse or fine, leading to variability.
The Nanotrac Flex DLS analyzer was used to determine the particle size distribution at each step in the emulsifying process to give a certifiable analysis. The final nanoemulsion was achieved by running a solution of 11.0 mg/mL CBD through five passes.
Figure 2 shows the number of passes at various homogenization pressures vs. the particle size. The size of the original emulsion was reduced to 168 nm from 330 nm as the number of passes increased to five.
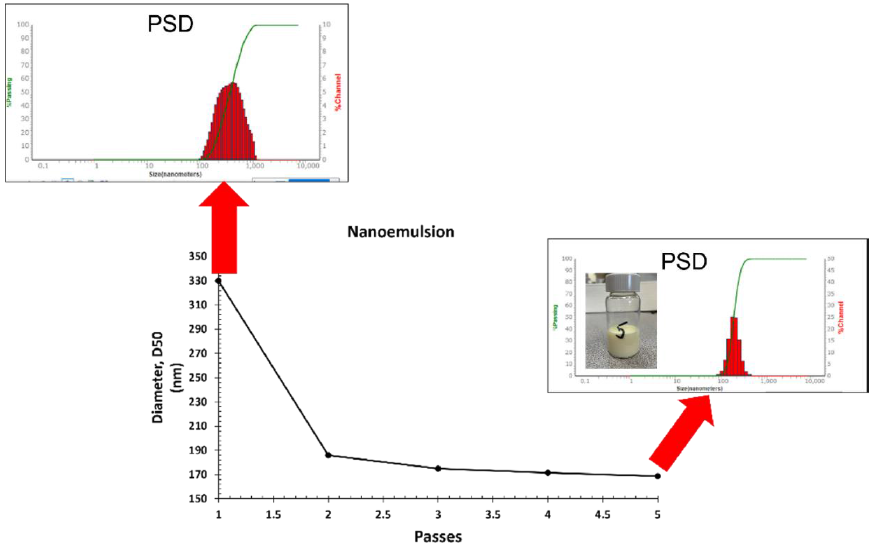
Figure 2. Particle size distribution (PSD) as a function of microfluidization passes. Pass five shows a CBD nanoemulsion of 168 nm from the original 330 nm starting solution. Image Credit: Microtrac MRB
The size distribution profiles of these nanoemulsions are observed as monodisperse and narrow and help to evaluate the stability in various conditions in the titration data.
Zeta potential is a method used to measure the surface charge of such oil-in-water nanoemulsions. Particles carrying strongly negative or positive zeta potential experience a strong repulsive electrostatic interaction, preventing them from forming aggregates.
The Stabino Zeta analyzed the stability prediction of these nanoemulsions, providing the zeta potential via streaming potential. Figure 3 shows the mean curve of eight averaged zeta potential and pH measurements, each over 30 seconds. The average pH and zeta potentials were 5.12 and -16.2 mV, respectively.
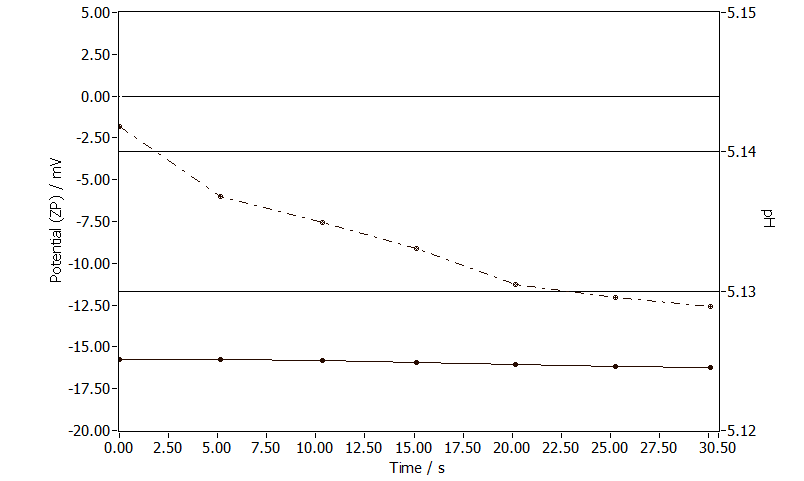
Figure 3. Average zeta potential (solid line) and pH (dashed line) over the course of 30 seconds for the resultant five-pass CBD nanoemulsion. Image Credit: Microtrac MRB
Zeta potential measurements are commonly performed with titrations and at different pH values. The Stabino Zeta allows these parameters to be measured simultaneously and does the same for particle size distribution. Changing the electrolyte concentration and composition can lead to a shift in the zeta potential.
Polyelectrolytes are frequently used to determine and directly measure the stability of the dispersions via polyelectrolyte titrations of nanoemulsions. In this study, polyelectrolyte titrations were performed to influence the zeta potential and find the zero point of charge, where the surface of the nanoemulsion is zero.
More specifically, the amount of charge necessary to overcome zeta potential repulsion - resulting in induced agglomeration - was determined. As the nanoemulsion had a negative zeta potential, 0.001 N PolyDADMAC, a cationic polyelectrolyte and known reference standard for PE-titrations, was used.
Figure 4 illustrates that only 0.62 mL of positive titrant, 0.001 N P-DADMAC, was needed to achieve the zero point of charge. As the zeta potential reached 0 mV (red line), the Nanotrac Flex simultaneously gave size distribution data (dashed line). Overall, the size of the nanoemulsion increased as the surface of the nanoemulsion became zero, indicating resultant agglomeration.
The small amount of titrant required and the increase in size clearly show that the solution becomes unstable as quantified by PE titration.
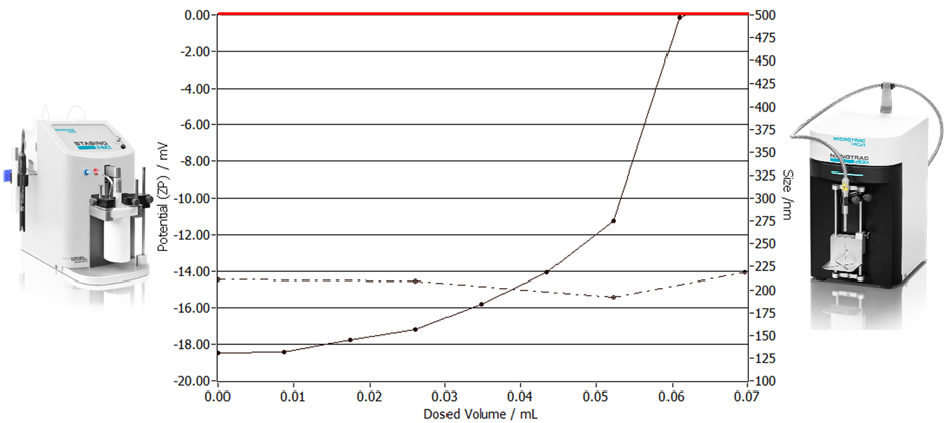
Figure 4. Polyelectrolyte titration, zeta potential (solid line) and PSD (dashed line) of five-pass CBD nanoemulsion. The zero point of charge (red line) was reached with 0.62 mL of P-DADMAC. Image Credit: Microtrac MRB
Summary
The powerful combination of the Nanotrac Flex and the Stabino Zeta has been used to show the simultaneous determination of several parameters within a few seconds, including streaming potential, zeta potential, particle size range, and pH.
This yields quality data regarding the particle size distribution of nanoemulsions as a function of stability and charge, which is essential to the process of cannabis formulation in terms of bioavailability.
Measuring the strength of repulsion and attraction was done via zeta streaming potential, which removes obstacles that are commonly known in classical electrophoretic measurements.

This information has been sourced, reviewed and adapted from materials provided by Microtrac MRB.
For more information on this source, please visit Microtrac MRB.