Sponsored by AvantesReviewed by Emily MageeOct 17 2022
Allura Red, a red powdered azo dye, is commonly used in the cosmetic, food, textile, paper, and drug industries. Allura Red goes by several names, the most common being Red 40 or E129.
Azo dyes are synthetic coloring agents with an azo group (-N=N-) in their chemical structure (Figure 1). Kinetics is the study of the rate at which a chemical reaction happens. This experiment applies kinetics to dye degradation.
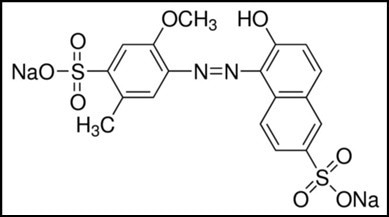
Figure 1. Chemical Structure of Allura Red. Image Credit: Avantes BV
Bleach was utilized as an oxidizing agent to degrade the color of Allura Red. The active ingredient in bleach is Sodium hypochlorite (NaClO), which affects the chemical composition of Allura Red and causes the red color to fade (Figure 2).
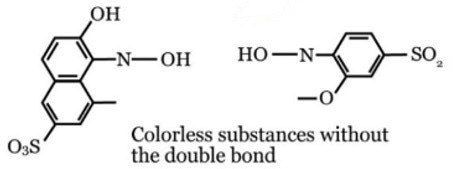
Figure 2. Chemical Structure after mixed with bleach. Image Credit: Avantes BV
In the experiment, the researchers measured the transmittance and absorbance of an Allura Red solution combined with a bleach solution. Allura Red absorbs green coloring (480–560 nm) and transmits red coloring (640–700 nm). The absorption measurement conversions were employed to solve for the unknown changing concentrations of Allura Red using Beer-Lambert’s Law.
Description of the System
The AvaSpec-ULS4096CL-EVO spectrometer was employed in this investigation (Figure 3). Instead of traditional CCD technology, this spectrometer uses CMOS (complementary metal-oxide-semiconductor) technology.
The AvaSpec-ULS4096CL-EVO has the latest AS-7010 electronics, which support USB3 and gigabit ethernet communication protocols. The AS-7010 (AKA EVO) electronics provide a faster microprocessor and 50 times more on-board memory, which aids the storage of more spectra facilitated by Avantes’ proprietary store-to-ram capability.
Integration periods as short as 9 microseconds and as long as 40 seconds are supported by the spectrometer detector. The spectrometer utilized for this experiment was configured with a 300 groove/mm UA grating with a range of 200–1100 nm. This experiment measured data in the visible range (380–780 nm).
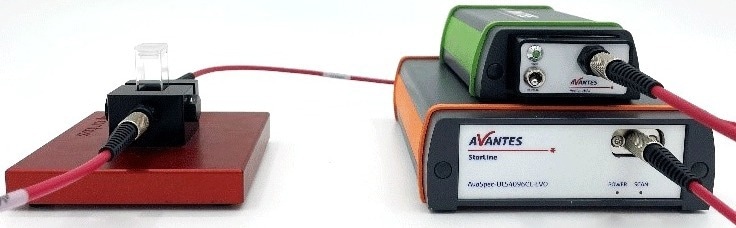
Figure 3. Absorbance/Transmission Setup. Image Credit: Avantes BV
The experiment used the AvaLight-HAL-S-Mini, a Tungsten-Halogen light source frequently used for spectral measurements in the visible to near-infrared wavelength ranges. This is a compact, stabilized halogen light source with adjustable focusing of the fiber connection, optimizing output power at the required wavelength.
The light source also includes an adjustable output power that can offer more power or longer lamp life according to the application's requirements. The AvaLight-HAL was selected for the experiment since it is ideal for transmittance and absorption measurements in the visible spectrum. This light source’s wavelength range is 360–2500 nm.
The AvaLight-HAL-S-Mini also has an internal TTL-shutter that can be controlled by an AvaSpec Spectrometer. This allows the light source to be occasionally shuttered to take a dark in an experiment or process. This shuttering can be performed manually or through software control.
The system also included a cuvette sample holder and two 400-micron UVIR fiber optic cables. The cuvette sample holder is intended for fluorescence and absorption measurements and should be used in combination with a standard 10 × 10mm cuvette. Inside the sample holder, a quartz cuvette was employed. To link the light source and cuvette, as well as the spectrometer and cuvette, two 400-micron UVIR broadband fiber optic cables were employed.
Description of the Methodology
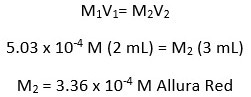
For this experiment on degradation, two solutions were made. The Allura Red solution was first, followed by the bleach solution. The bleach and Allura Red were diluted with deionized water (DI). The concentration of the Allura Red solution was 5.03 × 10⁻⁴ M (mol/L), and the sodium hypochlorite content in the bleach solution was 0.163 M.
When the two solutions were combined, the bleach solution diluted the Allura Red to a new concentration at time zero. The new Allura Red concentration in the combined solutions was 3.36 × 10⁻⁴ M. While the concentration of sodium hypochlorite remained constant over time, the concentration of Allura Red decreased. All calculations are shown below.

Bleach Solution NaClO Concentration
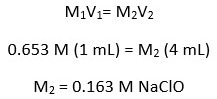
The bleach used had 4.5 % NaClO and a density of 1.08 g/mL. For this calculation, the researchers assumed 100 g of solution. The first step was to identify the moles solute, while the second step was to identify the liter of solution.
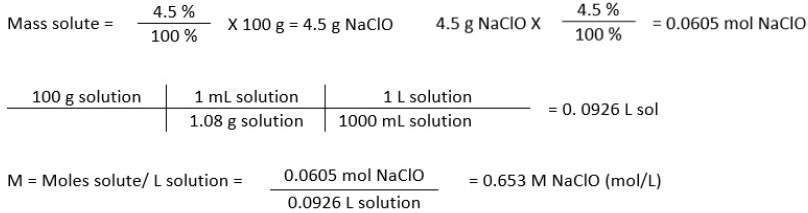
The dilution ratio of the bleach solution was 1 to 4. This meant that there were three parts of deionized water to one part of bleach. Therefore, after the dilution, the concentration of NaCLO became 0.163 M NaClO.
Mixed Solution Allura Red Concentration at t = 0
The mixture consisted of 2 mL of the Allura Red solution and 1 mL of the bleach solution.
The experiment was run three times to verify the chemical reaction time before the samples were tested in the cuvette holder. Degradation of the dye was complete in approximately one minute, and during that time, the red color faded until it became clear (Figure 4).
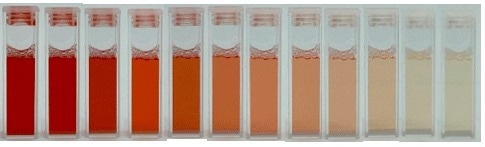
Figure 4. Dye Degradation of Allura Red. Image Credit: Avantes BV
Test Data and Results
The spectra for this kinetics experiment were periodically saved using an AvaSoft feature. After a five-second delay, the spectra were saved every second for 90 seconds. The chemical reaction rate was roughly 60 seconds, but 30 seconds were added as a buffer for the readings. Before adding any sample to the cuvette holder, light and dark references of air were taken.
Once it was ready to test, the Allura Red solution and bleach solution were rapidly mixed and shaken in a cuvette before being placed in the cuvette holder. The readings began and saved 90 scans. This test was run three times to guarantee consistent findings. The testing was carried out in transmittance mode (Figures 5, 6, and 7).
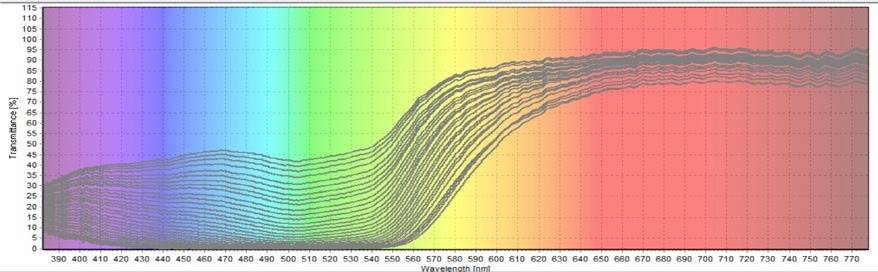
Figure 5. First Transmittance Test on Allura Red Degradation. Image Credit: Avantes BV
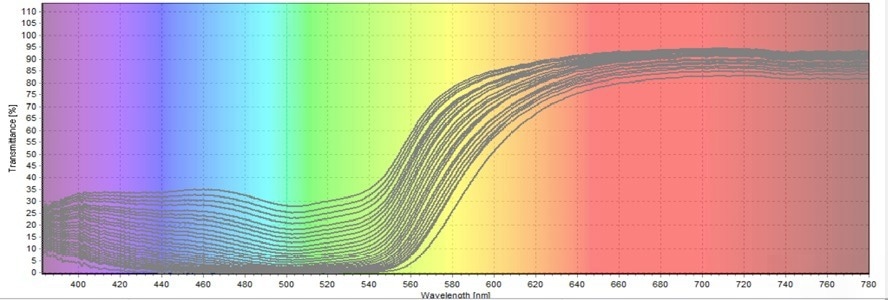
Figure 6. Second Transmittance Test on Allura Red Degradation. Image Credit: Avantes BV

Figure 7. Third Transmittance Test on Allura Red Degradation. Image Credit: Avantes BV
Initially, the scientists intended to use absorbance measurements; however, the absorbance spectra were noisy and difficult to see. Therefore, the scientists used the transmittance data instead and then converted the data to absorbance later in the experiment for analysis. Transmittance and absorption have an inverse relationship.
Analysis
The findings from all three transmittance tests reveal that the transmission percentage of green color continuously increases. As the figures demonstrate, the green coloring encompasses the wavelength range of 480–560 nm. The less Allura Red there is, the more green light will be transmitted.
The transmittance results were initially converted into absorbance to determine the unknown concentrations. For this conversion, the third transmittance test was employed. A wavelength of 520 nm (Figure 8) was used for the computations. This wavelength was chosen because it was midway into the green wavelength range.
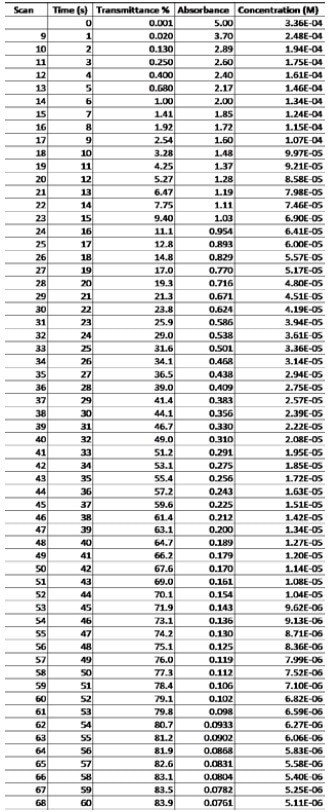
By locating the maximum peak at the given wavelength, the transmittance percentage was determined. Out of the 90 scans, the scientists used the 60 scans of the true start and end times of the chemical reaction for the calculations. The additional 30 scans were added to buffer the final round and the first couple of scans. These extra scans were excluded from the analysis.
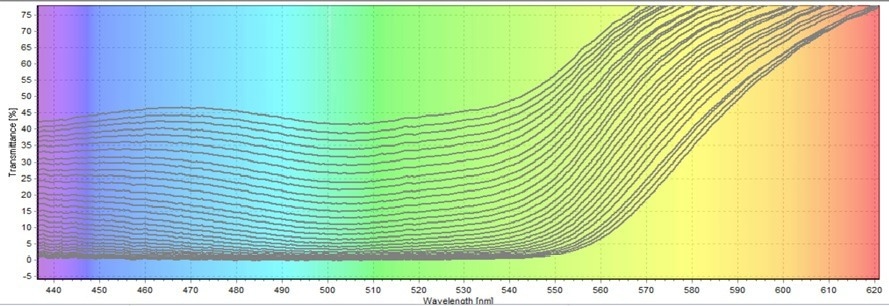
Figure 8. 520 nm wavelength window to use in the absorption conversion. Image Credit: Avantes BV
Absorbance is calculated as a logarithmic function, and the formula A = 2 – log10 (% T) was used to convert the transmittance percentage. After converting the 60 transmittance percentages to absorbance, a t = 0 data point was added.
Transmission cannot equal zero because it is a logarithmic function. The t = 0 transmittance percentage was, therefore, set to 0.001. With these data points, kinetic graphs of transmittance and absorption for the 520 green wavelength of the Allura Red dye degradation solution (Figures 9 & 10) were plotted.
Figure 9 depicts a continuous increase in green light transmission, while Figure 10 depicts a sudden decrease in green light absorption. These validate the logarithmic relationship.
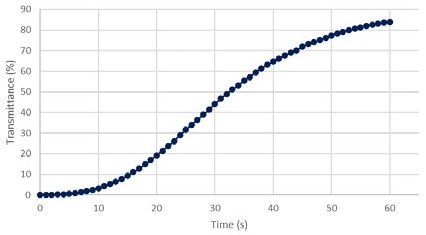
Figure 9. Transmittance % vs Time at 520 nm green. Image Credit: Avantes BV
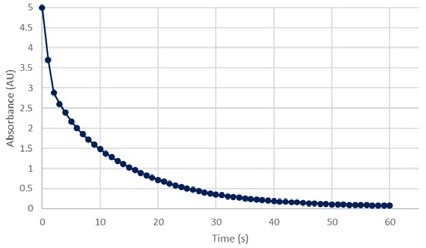
Figure 10. Absorbance vs Time at 520 nm green. Image Credit: Avantes BV
After calculating the absorbance, Beer’s Law was employed to determine the approximate concentrations of Allura Red with respect to time. Beer-Lambert’s Law is A = εbC, where ε is molar absorptivity, b is the length of the light path, and C is concentration.
The cuvette used was 10 mm × 10 mm, resulting in a path length (b) of 1 cm. The known 3.36 × 10⁻⁴ M Allura Red concentration at t = 0 was used to calculate the molar absorptivity. The absorbance was found using the transmission percentage of 0.01 in the equation A = 2 – log10(% T). Therefore, the absorbance from that transmission percentage was around 5.
Solving for molar absorptivity provided the value of 14893 M-1cm-1. Using that value for ε, the researchers then solved for the concentrations (Appendix A). After approximate concentrations were evaluated, the scientists plotted the data points against time to make another kinetic graph (Figure 11).
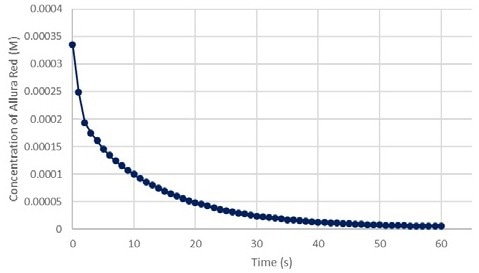
Figure 11. Absorbance vs Concentration of Allura Red at 520 nm green. Image Credit: Avantes BV
Figure 12 shows that the relationship between absorptivity and concentration is linear. The slope of the line indicates the molar absorptivity (ε), and the y-intercept of the line should be zero.
The equation plotted below has a y-intercept of 2 × 10-16, which is essentially zero. This linear equation, however, reveals that the relationship is not perfect. This was expected since the t = 0 transmission percentage was approximate.
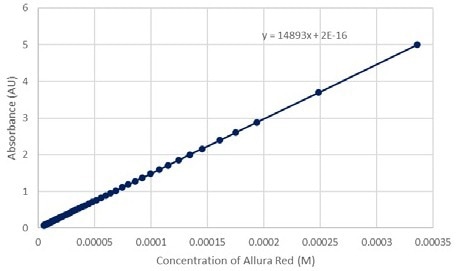
Figure 12. Absorbance vs Concentration of Allura Red at 520 nm green. Image Credit: Avantes BV
Conclusion
The researchers could determine approximate Allura Red concentrations during dye degradation by employing the transmittance spectra from the cuvette holder spectroscopic system.
The oxidizer was bleach, while the active component was NaClO (sodium hypochlorite). The NaClO modified the chemical structure of Allura Red, splitting the double bond (-N=N-). This change rendered the solution colorless.
Through periodically saving the spectra through AvaSoft, the scientists could run analytical tests at a specific wavelength. The chosen wavelength was 520 nm, as that was where they could see the transmission of green light. The stronger the green light transmission, the less Allura Red remained in the sample.
The researchers then converted the transmittance percentage into absorbance measurements before solving for the concentration of Allura Red through the use of Beer-Lambert’s Law. Kinetic models were later developed using the data obtained. Absorption, transmittance, and concentration were all respectively measured against time.
A chemometric module is also included in the Avantes AvaSoft software, which can facilitate Beer-Lambert concentration experiments.
Appendix A: Concentration Calculations
Source: Avantes BV

This information has been sourced, reviewed and adapted from materials provided by Avantes BV.
For more information on this source, please visit Avantes BV.