Parboiled rice, also known as converted rice, is rice that has been precooked partially in its inedible husk, similar to how potatoes can be parboiled in their skin.
The International Standards Organization (ISO) indicates that parboiled rice is rice that undergoes a hydrothermal treatment to fully gelatinize the starch. At this point, it is then subjected to a drying process.1
The three fundamental steps of parboiling are soaking, steaming, and drying. For centuries, people in Asian and African countries have been parboiling rice as it makes the husks easier to remove by hand.
When compared to white rice, parboiled rice contains fewer calories, fewer carbohydrates, more fiber, and more protein - making it a healthier alternative to traditional white rice. Among the various kinds of rice, when cooked, the extra long grain parboiled rice is light and fluffy, and the rice separates well, making it ideal for use in rice salads, fried rice, and rice pilaus.
Parboiled milled rice is parboiled rice that has been subjected to milling and polishing to remove its husk, bran, and germ. The milling and polishing process modifies the flavor, texture, and appearance of the rice and can prevent spoilage. It also improves storage life and makes the rice easier to digest.2
However, during the milling and polishing process, white rice kernels can be broken or fractured and prone to breakage during processing or transportation. Broken white rice has less inherent value, and as such, it is less appealing to buyers or sellers, typically coming with a lower price tag to compensate for the inferior quality. The more breakage that occurs, the lower the price tag goes.
To properly separate broken from unbroken rice, a measurement of biometric characteristics is necessary. According to ISO standards, biometric characteristics are the length, width, and thickness of the kernel measured along each of the three Cartesian axes.3
Among each of the characteristics, the length is considered to be the most important one. When a rice kernel breaks, it often cracks horizontally. Therefore, when compared to unbroken rice grains, the length of broken rice kernels is generally smaller, while the width remains the same.
ISO definitions of the broken rice kernel and chip are predicated on the length of rice kernels, as displayed in Figure 1. In contrast to the whole kernel, if 1/4 of the full length is lost, a kernel is called a large broken kernel.

Figure 1. The ISO definition of broken rice kernels and chips1. Image Credit: Bettersize Instruments
If a kernel has only 1/4 of its full length left, it is known as a small broken rice kernel. A chip refers to a piece of the broken rice kernel, the length of which is smaller than 1/4 of full length and is able to pass through a test sieve with round apertures of a diameter of 1.4 mm.
Additionally, measuring the size and shape can be useful when it comes to separating rice grains from impurities, as those not measured cannot be controlled. This includes impurities such as extraneous and other unwanted matters in parboiled milled rice products, including stones, brans, and immature or malformed kernels.
Those impurity particles are typically in sizes or shapes that differ from the unbroken parboiled milled rice products. Thus, it can be useful to identify extraneous matters and calculate their content, particle size, and shape measurement.
How Dynamic Image Analysis Can Help to Control the Quality of the Parboiled Rice
To measure the rice, dynamic image analysis (DIA) is employed, which only involves two steps. Firstly, moving particles pass between the light source and cameras that have the capacity to measure down to the microscopic level. The camera captures projection images of particles and then sends them to a connected computer.
The second step involves processing and analyzing all these projected images. The analysis includes the calculation of the perimeter, the area, and other size and shape characters from these projected images.
The second step is achieved with the application of unique software installed on the computer that is capable of measuring all the shape parameters from the sample load in a short space of time.
As previously mentioned, the ISO has set the biometric characteristics of rice kernels to include the length, width, and length/width ratio, all of which are measured in real-time by Dynamic Image Analysis.
After all the size and shape characteristics have been measured to collect the results for every individual particle, a statistical analysis of every particle measured can be run. Statistical analysis results are indispensable when assessing parboiled milled rice products.
With these specific size statistics, it is relatively easy to obtain the percentage of particles with special specifications. For instance, every particle with a length smaller than 5 millimeters can be found easily. When compared to the conventional sieving method, the DIA method is more effective for analyzing the size of rice kernels.
However, it is important to note that the sieving method only imparts information on the particle size distribution from a few sieve fractions, whereas the DIA method gives users a higher resolution particle size distribution across a wide range of sizes from microns to millimeters.
In contrast to the microscopic method (also known as static image analysis, SIA), the DIA method has the ability to analyze an increased number of particles in the same length of time by leveraging a moving sample particle flow. The benefits that come with measuring an increased number of particles improve the efficiency and reliability of the test results.
Dynamic Image Analysis of Parboiled Milled Rice
Sample and Instrument Used
Parboiled milled rice samples used in this article originate from three different batches of long-grain basmati rice, as displayed in Figure 2. The overall net weight of sample 1 is 374.32 g, weights of sample 2 and sample 3 are 380.27 g and 376.54 g, respectively. All three samples are produced by the same producer in Harbin, Heilongjiang province, China.

Figure 2. Part of sample 1 used in this test. Image Credit: Bettersize Instruments
Samples 1 and 2 are premium-level products of the brand, and sample 3 is a standard-level product. All three samples are packed tightly into a plastic bag to limit the chance of breakage when being transported.
The instrument employed during the analysis was Bettersize’s BeVision D2, which is a DIA analyzer. To ensure whole rice kernels are captured by the digital camera, the BeVision D2 utilizes a 0.132 magnified objective lens.
The BeVision D2 works in combination with the Bettersize dynamic image particle size and shape analysis system software V4.0 (the software), which is installed on the computer. Accessory and add-on equipment include spoons for adding samples and clean beakers as containers.
Experimental Design
In each test, the BeVision D2 offers accurate sizing and shaping results in the form of particle size and shape parameters for every milled rice particle that is parboiled. These size and shape parameters include length (long diameter), width (short diameter), and length/width ratio (L/W ratio). The software is also able to form statistics by summing the single-particle data up.
The size and shape tests of samples A, B, and C were repeated three times to minimize random errors. After each test, the sample was recovered and gathered in the sample collector of the BeVision D2.
For each parameter, records and results of each test were saved in the database of the software such that future processing and analysis of any parameters could be run at a later date.
A comparison of biometric characteristics is an absolute necessity when it comes to comparing the quality of various parboiled milled rice products properly. The BeVision D2 offers scatter plots that provide a comparison of particle size distributions and particle size-shape.
Particle Size and Shape Analysis of Samples as Whole
Figures 3 and 4 show that all three samples demonstrate similar length and width distributions. The particle size distribution in sample 1 is almost identical to sample 2, suggesting a good quality control of premium-level products.

Figure 3. Particle length distribution of rice kernel samples. Image Credit: Bettersize Instruments

Figure 4. Particle width distribution of rice kernel samples. Image Credit: Bettersize Instruments
However, there are greater amounts of smaller size (length) particles in sample 3, which may signal broken kernels, chips, or other impurities.
No undersized particles are shown in sample 1 and sample 2, again keeping in good consistency with the ISO standard. However, there is a considerable number of fines in sample 3, which suggests that the content contains undersized broken rice kernels with possible sands (extraneous inorganic matter).
Thus, samples 1 and 2 are of passable quality, and to improve the quality of sample 3; it would need to endure a series of industrial sieves to separate the fines. Interestingly, the short diameter (particle width) distributions of all three samples possess a similar mode, even though there is a considerable difference in the particle length distribution.
Often, when breaking a rice kernel, it cracks horizontally, meaning while the width distribution of the rice is not usually affected, the length is significantly reduced.
Evidence for this is seen in the variance of single-particle images, as displayed in Table 3. It is clear that the particles of sample 1 and sample 2 are of similar size and shape, so a comparison between sample 1 and sample 3 shows the differences between different products of varying quality.
Figure 5 demonstrates the distribution relationship between the long diameter (length) and the area equivalent diameter (xA, a measurement of projected area) of rice kernels.

Figure 5. Particle length – area equivalent diameter scatter plot of rice kernel samples. Image Credit: Bettersize Instruments
Accordingly, the undersized particles in sample 3 are smaller in both length and projected area, as well as in volume. This result consolidates the point that to improve quality, sample 3 should be subjected to a series of industrial sieves to separate the fine particles.
The particle area equivalent diameter number distribution comparison between sample 1 and sample 3 is displayed in Table 1. There is a similarity in the total number of particles, but as exhibited in Table 1, sample 1 has a narrower distribution total, and there are an increased number of finer particles in sample 3 (larger L/W ratio and smaller aspect ratio).
Table 1. Particle area equivalent diameter number distribution comparison. Source: Bettersize Instruments
| xA(μm) |
Sample 1 |
Sample 3 |
| 1445.44 -1584.89 |
0 |
13 |
| 1584.89 -1737.80 |
0 |
18 |
| 1737.80 -1905.46 |
0 |
57 |
| 1905.46 -2089.30 |
0 |
223 |
| 2089.30 -2290.87 |
2 |
828 |
| 2290.87 -2511.89 |
237 |
1507 |
| 2511.89 -2754.23 |
1782 |
2292 |
| 2754.23 3019.95 |
4357 |
3935 |
| 3019.95 -3311.31 |
7146 |
6110 |
| 3311.31 -3630.78 |
5854 |
5005 |
| 3630.78 -3981.07 |
2050 |
1339 |
| 3981.07 -4365.16 |
28 |
0 |
| Total number |
21456 |
21327 |
The typical value comparison of particle shape parameters can be seen in Table 2. The S10, S50, and S90 stand for shape parameter value points below which 10%, 50%, and 90% of the material are contained.
For the most part, the typical trend of particle shape distributions of sample 1 and sample 3 is similar, but as displayed in Table 2, sample 1 is less rounded in total (smaller circularity) with a greater number of elongated particles (larger L/W ratio and smaller aspect ratio).
Table 2. Particle shape distribution comparison. Source: Bettersize Instruments
| Parameter |
Sample |
Average |
S10 |
S50 |
S90 |
| L/W ratio |
Sample 1 |
2.190 |
1.615 |
2.157 |
2.786 |
| Sample 3 |
2.073 |
1.365 |
2.070 |
2.756 |
| Aspect ratio |
Sample 1 |
0.472 |
0.358 |
0.461 |
0.607 |
| Sample 3 |
0.505 |
0.262 |
0.480 |
0.695 |
| Circularity |
Sample 1 |
0.883 |
0.827 |
0.883 |
0.939 |
| Sample 3 |
0.893 |
0.829 |
0.891 |
0.959 |
Particle Size and Shape Analysis of the Finer End of Samples
In line with PSD comparison, differences between sample 1 and sample 3 are concentrated on the finer ends of the two samples. Thus, it is necessary to form a discussion that focuses on the finer particles of two samples.
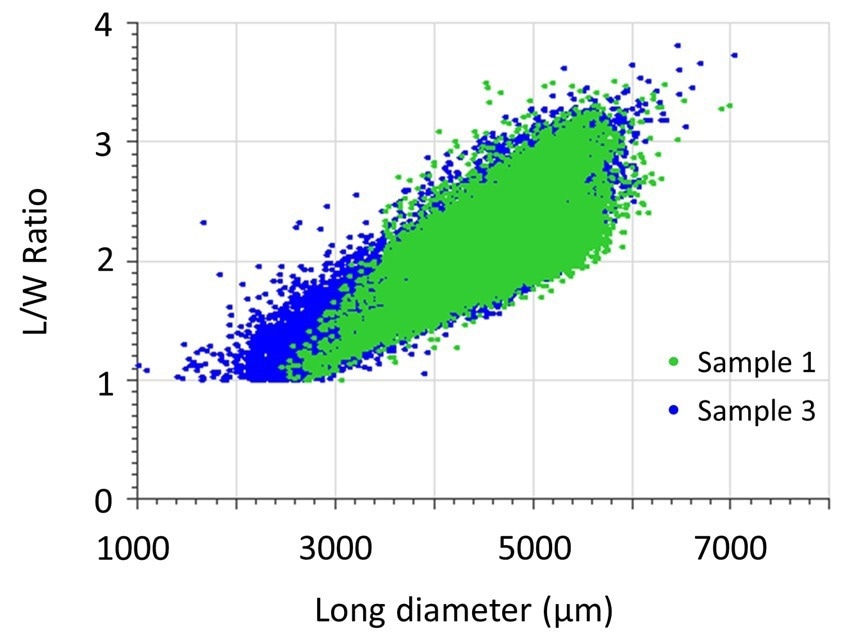
Figure 6. Particle length - length/width ratio scatter plot of rice kernel samples. Image Credit: Bettersize Instruments

Figure 7. Particle length – aspect ratio scatter plot of rice kernel samples. Image Credit: Bettersize Instruments

Figure 8. Particle length - circularity scatter plot of rice kernel samples. Image Credit: Bettersize Instruments
Figures 6 to 8 display the shape parameter comparison between sample 1 and sample 3. These figures are particle length – L/W ratio relationship, length - aspect ratio relationship, and length - circularity relationship scatter plots.
It is clear to see that the finer particles’ length/width ratio values and aspect ratio of sample 3 are similar, while the circularity value is smaller. This suggests that, compared to the finer particles of sample 1, finer particles in sample 3 have a length similar to their width but a less rounded shape, which is characteristic of broken rice.
Compared with the finer particles of sample 1, all results indicate that the small particles contained in sample 3 are rounder in shape, although length and width are similar. This demonstrates that the small particles in sample 3 are less likely to be a whole rice kernel, which is typically elliptical in shape.
Therefore, this is good, reliable evidence to conclude that sample 3, which is an entry-level product of the manufacturer, will contain an increased number of broken grains of rice. This is consolidated by the picture of the small chips shown in Table 3.
As Table 3 proves, via the comparison of particles from the finer end of sample 1 and sample 3, those fine, less-rounded chips in sample 3 and round kernels in sample 1 correspond to what is displayed in the scatter plots.
Table 3. Particle shape data and image comparison. Source: Bettersize Instruments
| Sample |
Particle ID |
L/W ratio |
Aspect ratio |
Circularity |
Particle Image |
| Sample 1 |
9241 |
1.135 |
0.803 |
0.969 |
 |
| 3471 |
1.129 |
0.748 |
0.974 |
 |
| 11091 |
1.061 |
0.679 |
0.96 |
 |
| 19216 |
1.353 |
0.722 |
0.964 |
 |
| 8379 |
1.293 |
0.742 |
0.975 |
 |
| Sample 3 |
6216 |
1.125 |
0.795 |
0.912 |
 |
| 17760 |
1.029 |
0.773 |
0.938 |
 |
| 8542 |
1.3 |
0.719 |
0.943 |
 |
| 4806 |
1.176 |
0.74 |
0.918 |
 |
| 15737 |
1.147 |
0.789 |
0.928 |
 |
Conclusion
Particle size, especially the particle length and shape of rice kernels, significantly affects the commercial value of rice products. The BeVision D2 is a reliable instrument that provides particle sizing solutions that improve the quality control process of rice kernels.
Compared with traditional methods, such as sieving and microscopic evaluation, the BeVision D2 provides higher-resolution results with better efficiency.
The particle length distribution, width distribution, shape distribution (e.g., L/ W ratio, aspect ratio, and circularity), and single particle images provided by the BeVision D2 are much-needed evidence to determine the product quality, especially when there are seemingly small differences between samples on the surface, but when investigated further with the software tools, their difference is much more apparent.
References
- International Organization of Standardization [ISO]. (2021). ISO 7301:2021 Rice -specification. Geneva: ISO.
- ‘White rice’ (2021) Wikipedia. Available at: https:// en.wikipedia.org/wiki/White_rice (Accessed: 1 November 2021).
- International Organization of Standardization [ISO]. (2020). ISO 11746:2020 Rice - Determination of biometric characteristics of kernels. Geneva: ISO.

This information has been sourced, reviewed and adapted from materials provided by Bettersize Instruments.
For more information on this source, please visit Bettersize Instruments.
