Lithium-ion batteries are a kind of rechargeable battery that is charged or discharged through desorption or insertion of lithium ions (Li+) from or into the active material structure.
In recent years, the use of lithium-ion batteries has expanded, and research being performed to increase their potential, extend their life, decrease their cost, and increase their safety has been undertaken in an active manner.
The primary materials of lithium-ion batteries are the anode, cathode, separator, and electrolytic solution, along with the active material — the main material from which the electrodes are made — which is the most essential element for enhancing performance.
Over the last few years, the use of metal oxides and silicon as anode materials has been examined.
Silicon anodes exhibit a greater theoretical capacity compared to traditional carbon anode materials, so they are anticipated to help with the fabrication of higher-capacity lithium-ion batteries. On the other hand, charging and discharging can easily be accompanied by volumetric expansion and contraction, so there is the issue that the aging of the battery itself is faster when compared to carbon anode materials.
Therefore, an assessment of the properties of new materials is needed to enhance the anode materials’ performance. In this article, a case of measurement of deformation strength1 in compression tests has been initiated as a way to quantitatively assess physical properties.
The MCT-510 micro compression testing machine has been utilized for compression tests on minute samples and could be applied to adaptable anode materials. The deformation strength is quantitatively assessed via high-precision measurements of both displacement and force.
User Benefits
- The deformation strength can be calculated by performing compression tests on anode material one particle at a time.
- This provides a useful method for correctly analyzing the physical properties of particulate material without being affected by the experience of the analyst.
- This provides an index for evaluation of strength, for development of new anode materials.
Test Specimens
Table 1 displays information concerning the test specimens utilized in this test, and Figure 1 shows an image of a test specimen. When anode material is dispersed on the test specimen stand with a spoon, every particle can be observed utilizing the instrument’s microscope, as shown in Figure 1(b).
Table 1. Test Specimen Information. Source: Shimadzu Scientific Instruments
| . |
. |
| Specimen |
Three types of anode material (anode material a, anode material b, anode material c) |
| Material |
Carbon (graphite) |
| Particle diameter |
10-15 μm |
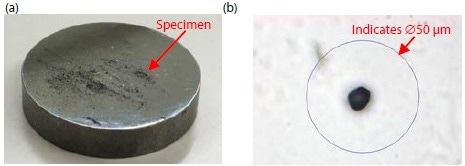
Figure 1. Test Specimen. (a) On the lower compression plate & (b) Particle observed with a 400 fold microscope. Image Credit: Dainen Material Co., Ltd.
Test Conditions
Figure 2 displays a view of the instrument and a schematic diagram of a test, and Table 2 represents the test conditions. With the availability of MCT-510, it is possible to execute a compression test on single particles and make use of the Side Observation Kit to view the compression on video.
In this case, the anode material utilized was graphite, so it was soft, and with this sample, it was hard to correctly identify the beginning of the compression test when the particle was contacted. To overcome this issue, soft material measurement mode*2 was utilized. The subsequent equation displays the calculation of deformation strength.
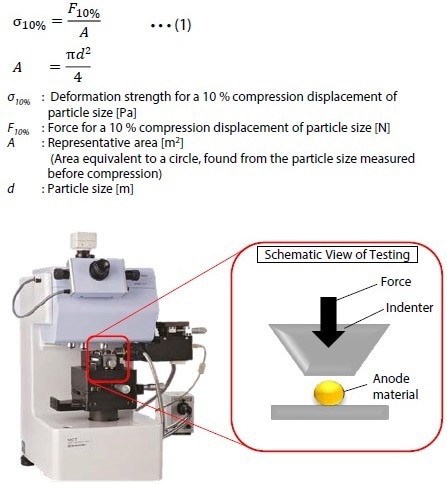
Figure 2. Test Apparatus and Schematic View of a Test. Image Credit: Shimadzu Scientific Instruments
Table 2. Test Conditions. Source: Shimadzu Scientific Instruments
| . |
. |
| Testing machine |
MCT-510 Micro Compression Testing Machine, Side Observation Kit, and Length Measurement Kit |
| Flat indenter (μm) |
∅50 |
| Test mode |
Soft material measurement mode |
| Test force (mN) |
10 |
| Loading speed (mN/second) |
0.2231 |
| Number of measurements (times) |
10 |
*2 Soft material measurement mode
In the standard measurement mode, the point at which the indenter contacts the sample is automatically recognized, so the compression test is started, and measurements can then be taken.
With soft samples, however, it is difficult to correctly detect the point at which the sample is contacted. In the soft material measurement mode, all the displacement-force data is collected before contact with the test sample until a set force is reached.
Therefore, even when the point at which the compression has started is unclear, the displacement-force data during the test can be properly obtained.
Results
Table 3 displays the test outcomes (average values), Figure 3 shows the test results (deformation strength at 5 points), and Figure 4 exhibits the force-displacement graphs. In these tests, more spherical particles were chosen, and after taking measurements on every ten particles for each material, the five points next to the central value were chosen.
Table 3. Test Results (Average Values). Source: Shimadzu Scientific
| Sample |
Anode material a |
Anode material b |
Anode material c |
| Average diameter [μm] |
13.32 |
12.54 |
13.11 |
| Deformation strength σ10% [MPa] |
7.29 |
3.04 |
13.66 |
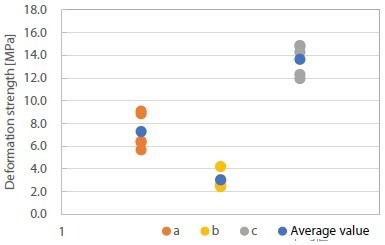
Figure 3. Test Results (Deformation Strength at Each of the 5 Points). Image Credit: Shimadzu Scientific Instruments
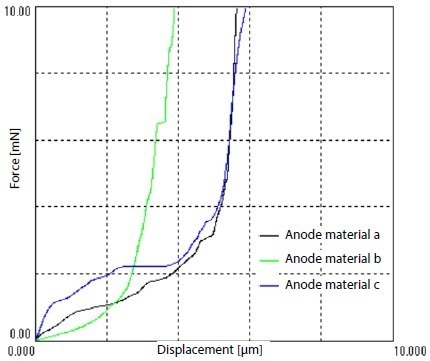
Figure 4. Force-Displacement Graph. Image Credit: Shimadzu Scientific Instruments
It was not possible to detect a clear failure point from Figure 4, and hence the deformation strength σ10% was calculated from the force when the deformation was around 10% of the particle diameter and utilized as a reference for comparison.
The order of the value of deformation strength of every material was as follows, and clear variations were discovered between each test sample. Anode material c > Anode material a > Anode material b.
The surface condition of every test sample seems to be different; anode material c was known as a carbon coating type, and anode material b was exposed. Hence, the variations were noted in the deformation strengths, and every test sample displayed its characteristics.
Figure 5 displays anode material a during the test, and the equivalent force-displacement graph. When the Side Observation Kit has been utilized, it is possible to connect the movement at every point shown on the force-displacement graph to the video taken at the time of the compression test.
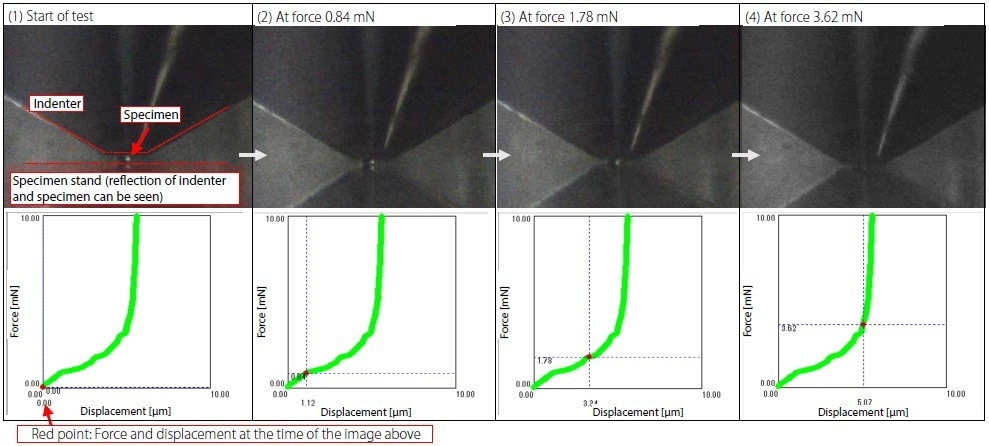
Figure 5. Anode Material a during Test, and Corresponding Force-Displacement Graph. Image Credit: Shimadzu Scientific Instruments
Every photo is an image that has been removed from the video taken with the help of the Side Observation Kit, and the red points on the force-displacement graphs denote the force and displacement on every photo.
The photos from (1) to (4) display the compression of the particle in a time series sequence, from which it can be viewed that, at around 0.84 to 3.63 N, the particle deformed in a considerable manner.
Conclusion
This article introduced an example of quantitative evaluation of anode material with the help of deformation strength, which is one of the mechanical evaluations.
One way of performing compression tests on powder particles is where a certain quantity of powder is placed in a container, and overall compression is applied. But in this technique, compression is employed for every separate particle, so the variations in strength between particles can be clearly observed.
In this example, compression tests were carried out using the MCT-510. This was so that the differences in strength as a result of the anode material could be obtained in units of one particle. In the future, it is anticipated that this will be applied to improve the quality of anode materials
The MCT-510 micro compression testing machine is highly beneficial for the assessment of not only small particles of anode material but also of cathode material, etc.

This information has been sourced, reviewed and adapted from materials provided by Shimadzu Scientific Instruments.
For more information on this source, please visit Shimadzu Scientific Instruments.