Sponsored by PerkinElmerReviewed by Olivia FrostMay 22 2023
Paints comprise several different ingredients, including pigments, fillers, binders, solvents, and additives, each of which has a specific purpose in the final product. Their formulation can incorporate a range of organic and inorganic compounds.
Most analytical techniques used for paint analysis face several difficulties because of the complexity, the multitude of components, and the high viscosity of most paint formulations, which frequently restricts the technique to partial analysis, such as solvent analysis by GC or GC-MS.
All components in a paint mixture can be examined using Fourier-transform infrared (FTIR) and an integrated sampling module for evolved gas analysis.
The PerkinElmer EGA 4000 is the first device in the world to integrate in-sample-compartment thermogravimetric analysis with infrared spectroscopy. The Spectrum 10 software contains all the necessary controls for the EGA 4000, so the entire experiment can be carried out using a single software platform.
Experimental
Two separate paint types—solvent-based and aqueous-based—were the subjects of a series of studies using the PerkinElmer Spectrum 3™ and the EGA 4000, depicted in Figure 1.
Figure 1. PerkinElmer Spectrum 3 with the EGA 4000 Accessory. Image Credit: PerkinElmer
Combining both approaches makes it possible to identify the materials present using the FTIR spectra and a wealth of information from the thermogravimetric analysis (TGA) weight loss curve.
Figure 2 depicts a typical weight loss curve when the sample is heated from room temperature to 700 °C. There are three separate weight losses. In the first of these, volatile compounds, such as solvents, will develop. The majority of the material will thermally degrade during the second stage.
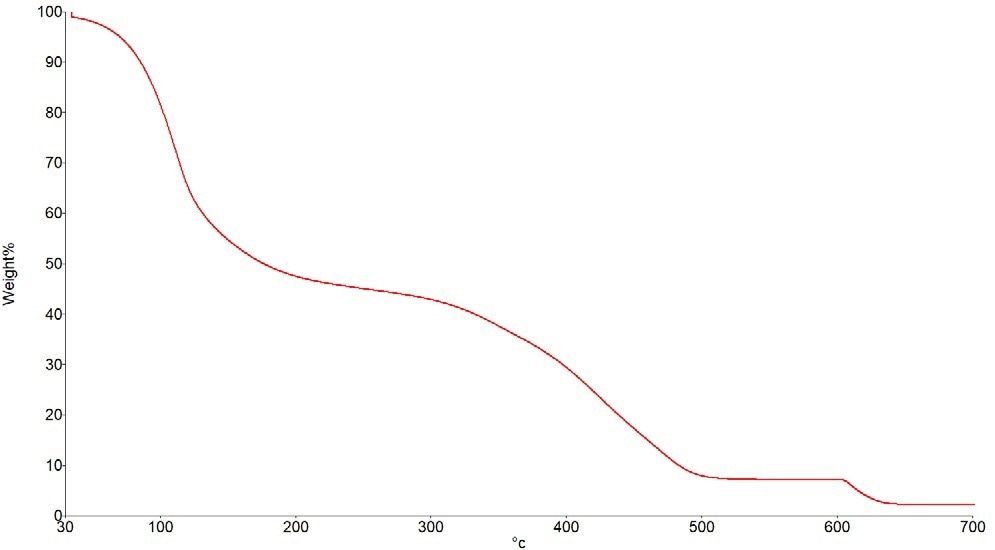
Figure 2. Typical Weight Loss Curve. Image Credit: PerkinElmer
Any residual soot or carbon will be burned off in the third stage, the combustion stage, using an air or oxygen purge gas. Any weight after the experiment will be an inorganic solid filler or pigment residue. An attenuated total reflectance (ATR) accessory can help users maintain and identify it.
Solvent Loss Experiments
A paint will gradually lose its solvent and other volatile compounds after being applied to a surface. Until all of the solvents have evaporated, the rate of solvent loss will fluctuate with temperature. The TGA curve can be employed to calculate the solvent content based on how much weight is lost.
For each of the two paints, two experiments were conducted employing hour-long isothermal periods at the two different temperatures of 30 °C and 50 °C.
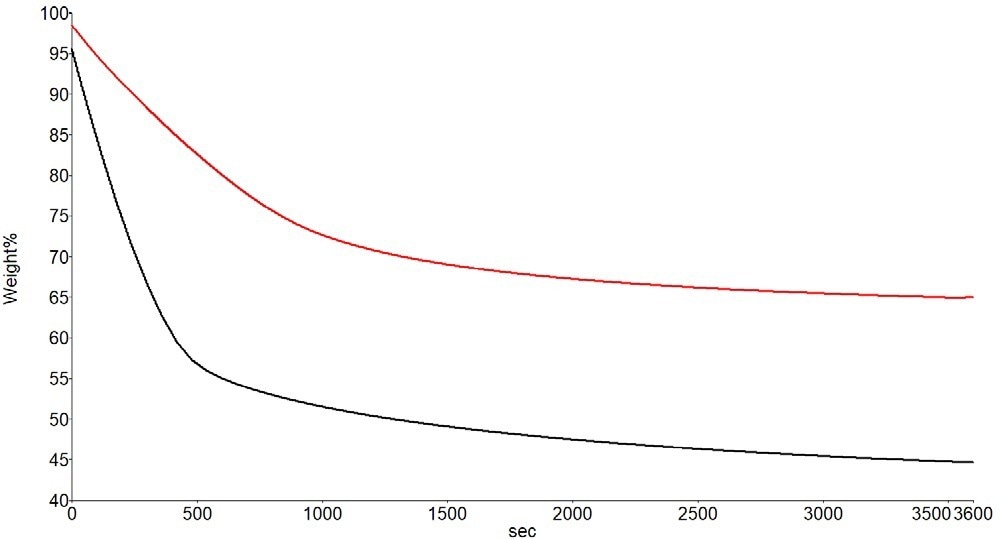
Figure 3. Weight Loss Curves for the Solvent-Based Paint at 30 °C (Red) and 50 °C (Black). Image Credit: PerkinElmer
These results demonstrate that the solvent evolves significantly more quickly at 50 °C for the sample, but at 30 °C, the solvent continues to evolve even after one hour. A small percentage of the solvent is lost immediately in the experiment at 50 °C when the sample is deposited in the hot furnace environment.
In the end (although not represented in this data), the weight loss caused by the solvent amounts to almost 50% of the sample in both studies. If necessary, a precise calculation of this weight loss can be made.
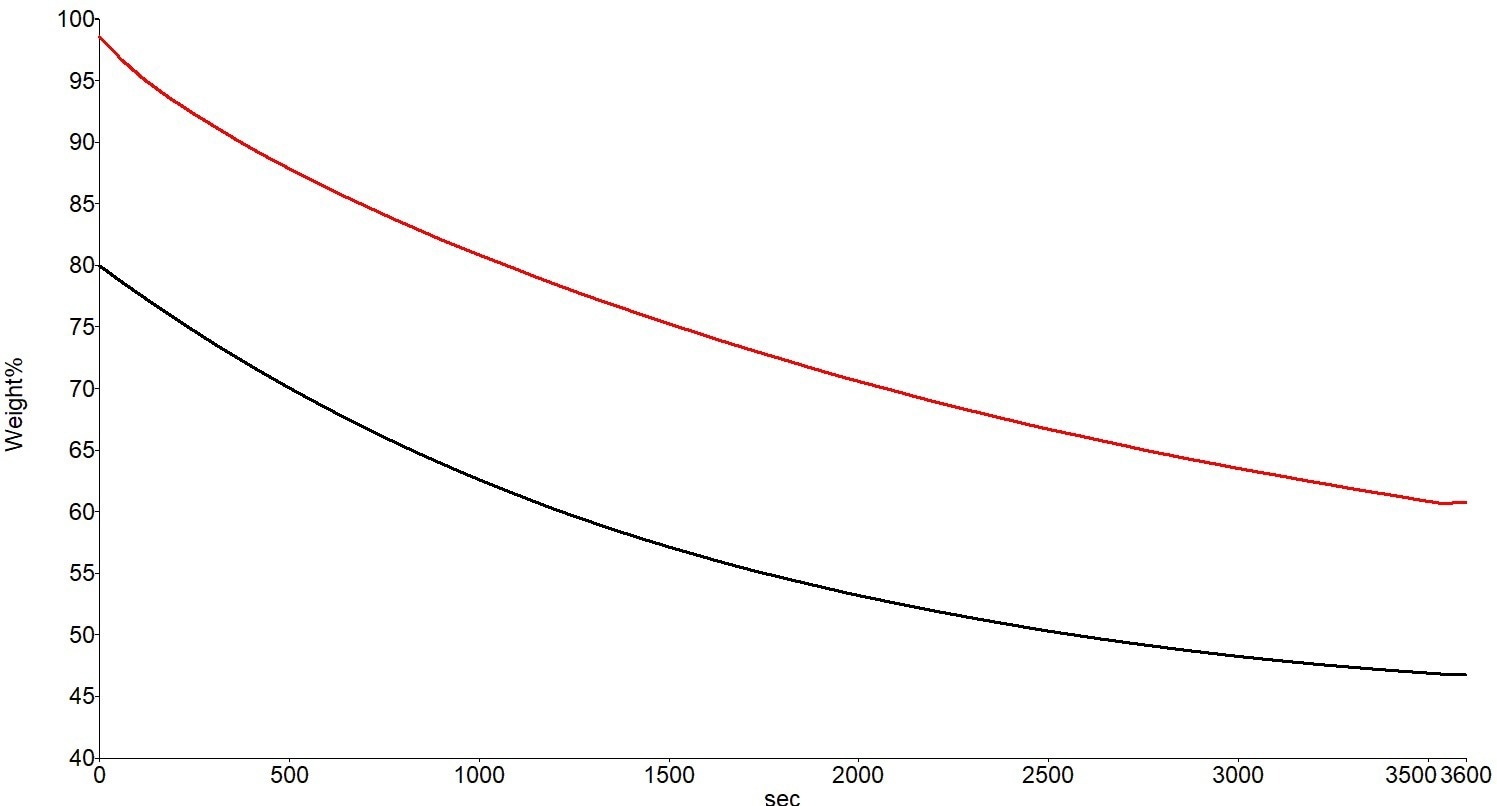
Figure 4. Weight Loss Curves for the Acrylic-Based Paint at 30 °C (Red) and 50 °C (Black). Image Credit: PerkinElmer
Similar data trends are seen in the acrylic aqueous-based paint sample. When the sample is at 50 °C compared to 30 °C, weight loss happens significantly more quickly, and the “solvent” evolution is not complete after an hour in either instance. Once more, the “solvent” is responsible for around 50% of the sample weight loss.
The samples were heated up to 700 °C in subsequent trials, allowing for the detection of additional volatiles and the identification of other materials contained in the formulations. Spectrum Timebase software was used for the experimental setup and data collection.
Acrylic-Based Paint
Figure 5 displays the results of the acrylic-based paint experiment. The results are shown by the weight loss curve and the Gram-Schmidt plot, which indicates the total IR absorbance for every recorded spectrum.
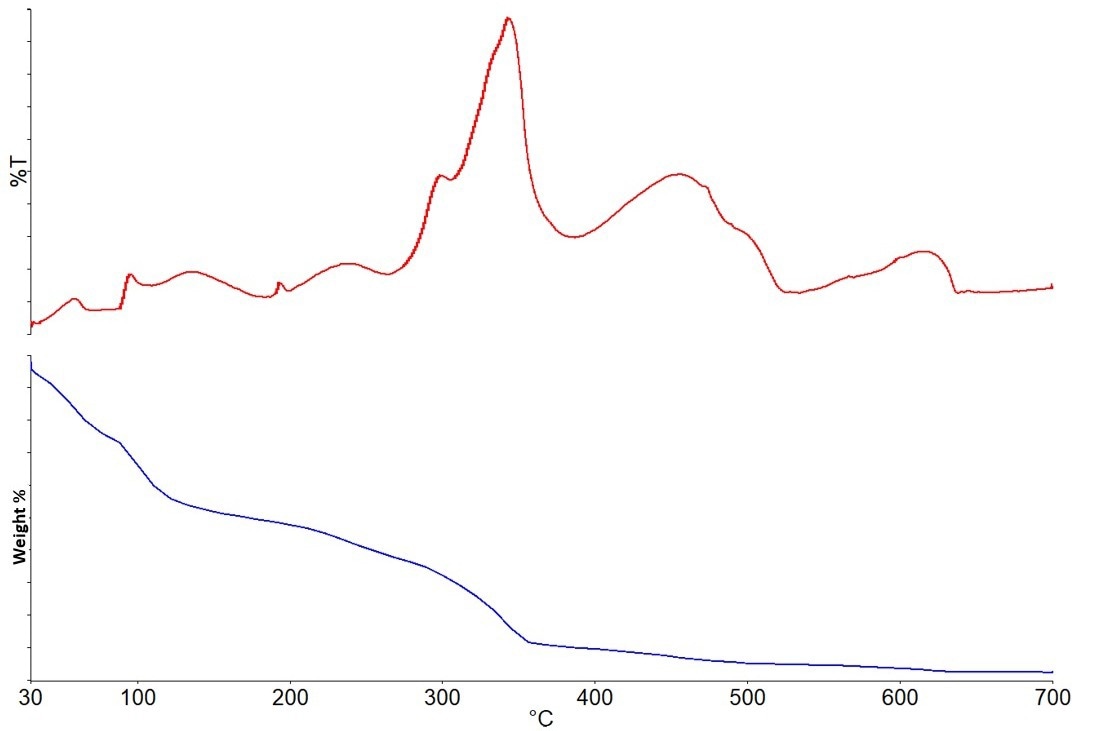
Figure 5. Gram-Schmidt plot (top) and Weight Loss curve (bottom) for acrylic paint sample. Image Credit: PerkinElmer
Different IR spectra can be visible at various times throughout the run due to the many developing gases. The gases produced by this sample are described in the section that follows.
Figure 6 depicts the first spectrum acquired, the spectrum of water vapor.
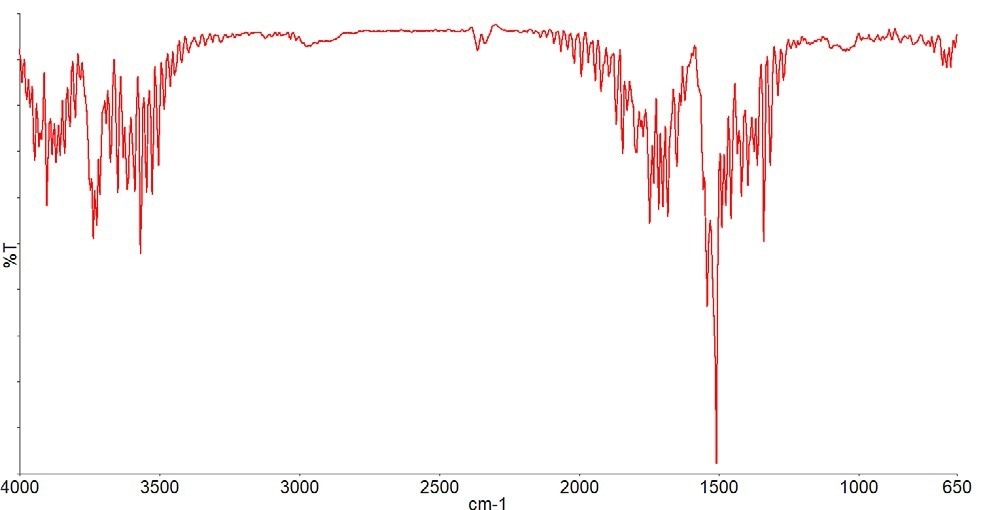
Figure 6. Spectrum showing the evolved water vapor. Image Credit: PerkinElmer
Figure 7a depicts the next gas that begins to form at around 130 °C, and the results table indicates that this gas has been recognized as propylene glycol (Figure 7b).
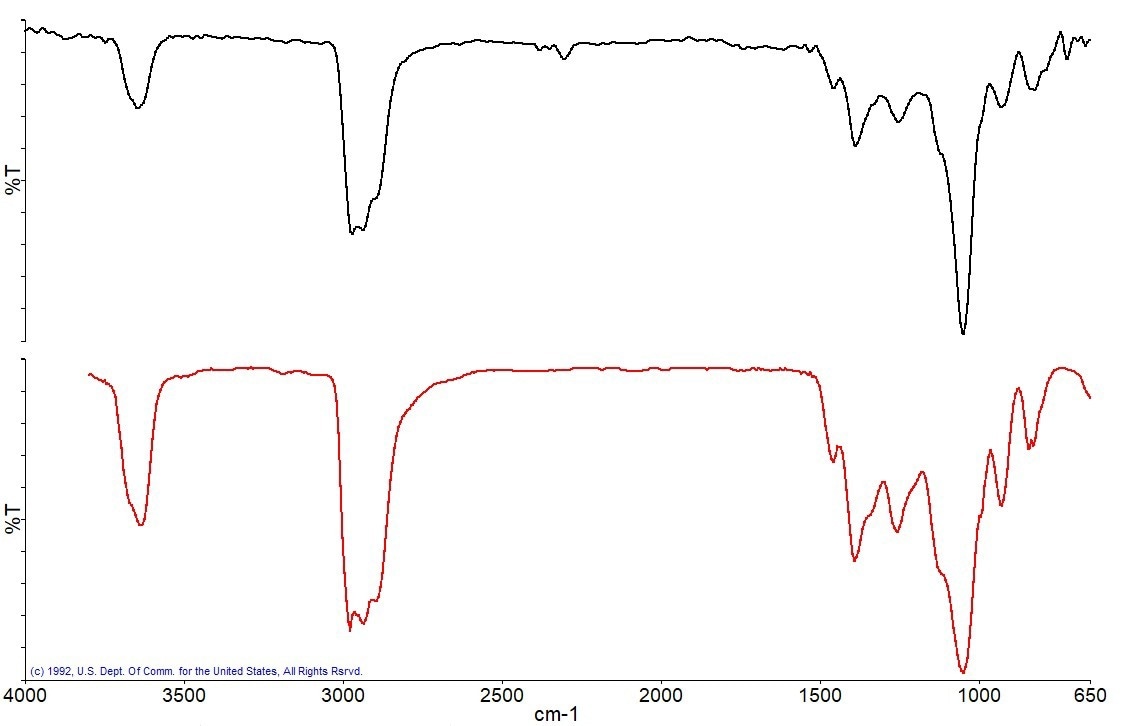
Figure 7a. Spectrum measured at 130 °C (black), best match library spectrum (red). Image Credit: PerkinElmer
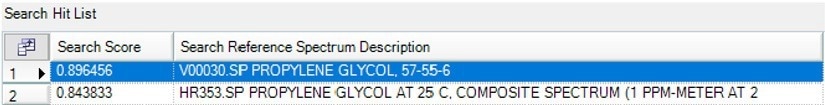
Figure 7b. Search Results of the spectrum at 130 °C showing Propylene Glycol as the best Match. Image Credit: PerkinElmer
Figure 8 illustrates the next distinct gas that emerged at about 235 °C and was recognized by the library search as 4-Methylbenzenesulfonamide.
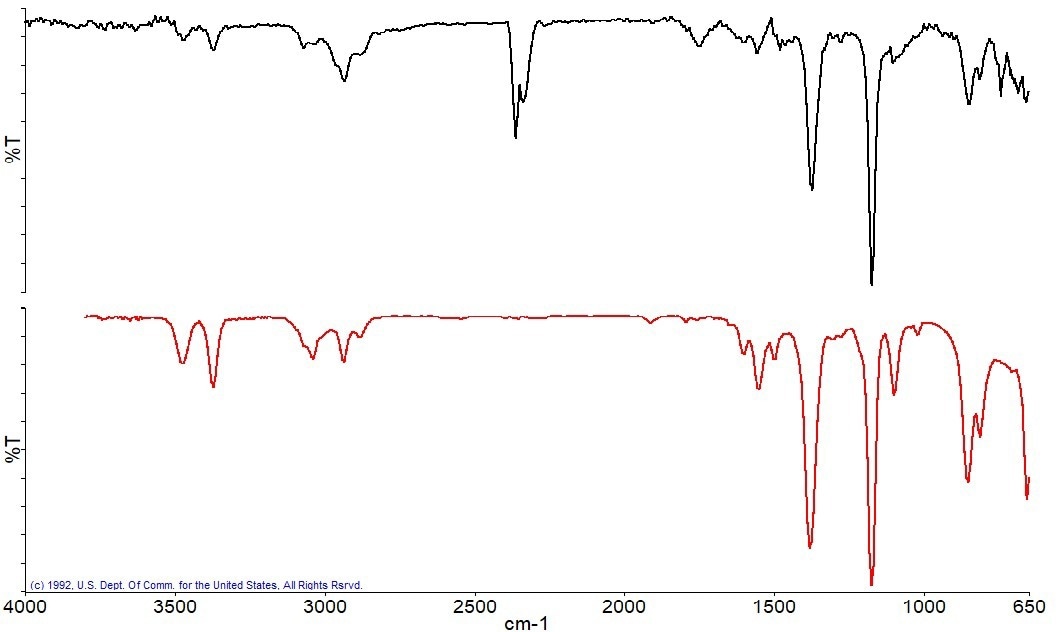
Figure 8a. Spectrum measured at 235 °C (black), best match library spectrum (red). Image Credit: PerkinElmer
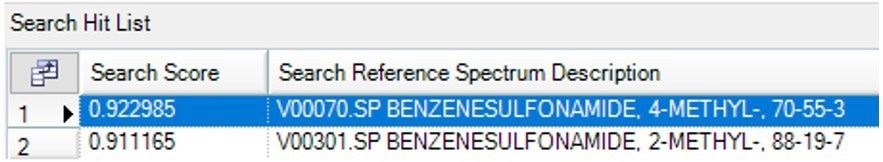
Figure 8b. Search Results of the spectrum at 235 °C showing 4-methylbenzenesulfonamide as the best Match. Image Credit: PerkinElmer
Due to the breakdown of the primary component, the substantial weight loss in this experiment peaks at a temperature of about 345 °C. When the obtained IR spectrum, depicted in Figure 9, was compared to spectral libraries, methyl methacrylate was identified.
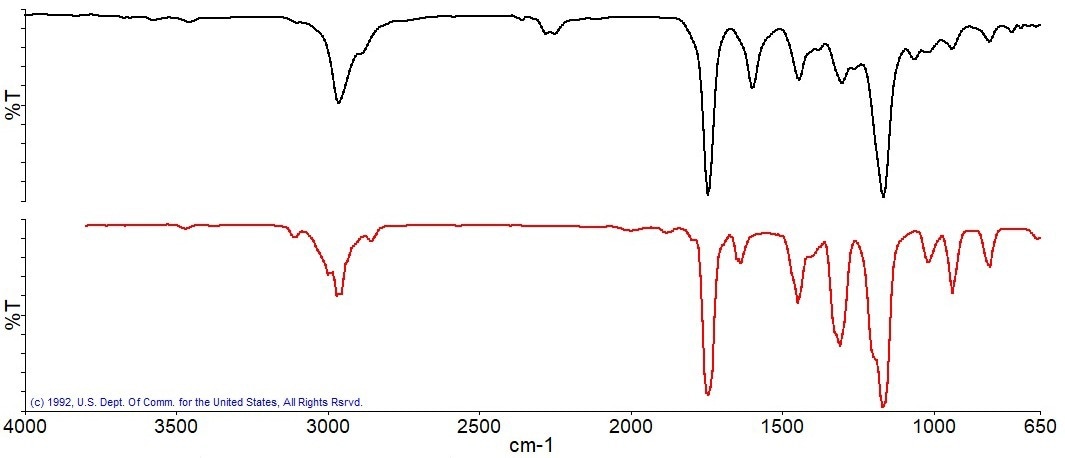
Figure 9a. Spectrum measured at 345 °C (black), best match library spectrum (red). Image Credit: PerkinElmer

Figure 9b. Search Results of the spectrum at 345 °C showing Methylmethacrylate as the best Match. Image Credit: PerkinElmer
This is frequently used as a binder to assist in developing the paint’s emulsion.
Some carbon is expected to be produced as soot during the thermal breakdown of the paint’s primary polymer system. When air is present in the purge gas, the carbon will be converted into carbon dioxide at higher temperatures, causing weight loss and carbon dioxide spectra detection.
Following the combustion of the carbon, a residue was left in the sample pan, which was scanned with an ATR accessory. The spectrum of this residue was subsequently examined using reference libraries to try to identify the material present. Anhydrite, an inorganic mineral, is the best library match for the ATR spectrum of the residue, as seen in Figure 10.
Figure 10a. ATR Spectrum of the residue(black), best match library spectrum (red). Image Credit: PerkinElmer
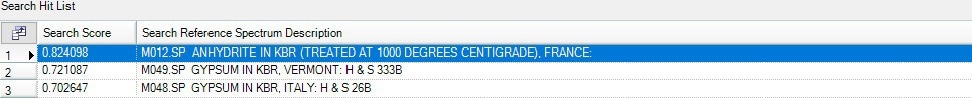
Figure 10b. Search results show Anhydrite as the best match compared to the collected Spectrum. Image Credit: PerkinElmer
Solvent-Based Paint
Figure 11 displays the results of the solvent-based paint experiment. The weight loss curve and the Gram-Schmidt plot, which represents the total IR absorbance for each spectrum recorded, are the results shown.
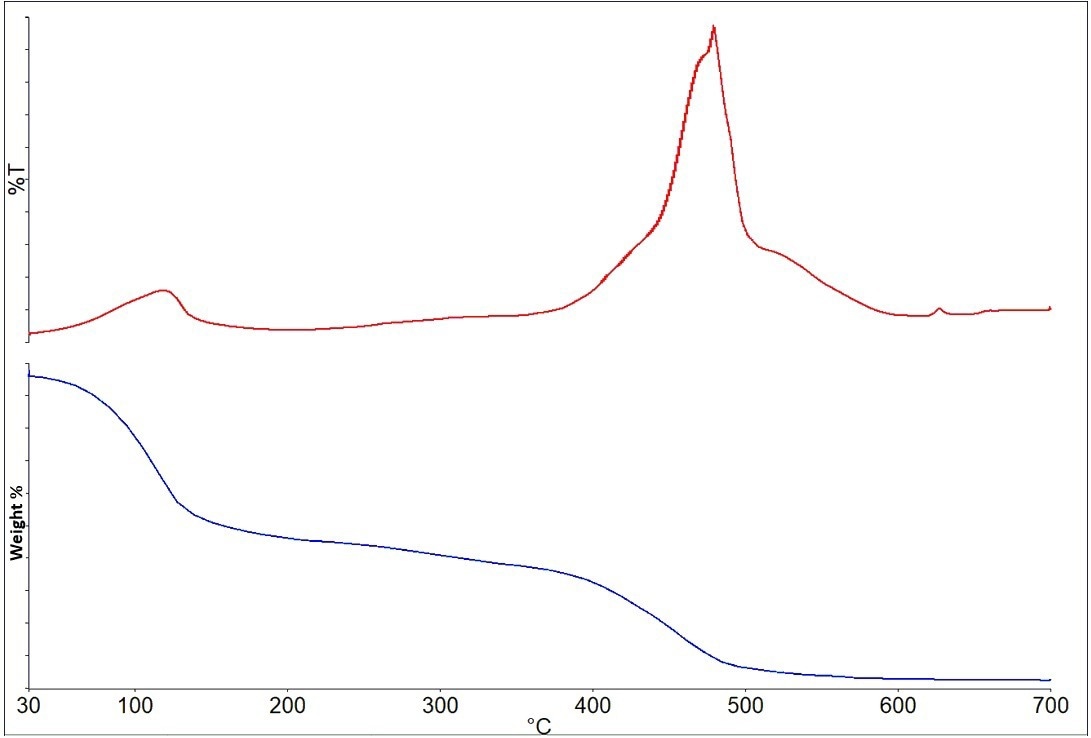
Figure 11. Gram-Schmidt plot (top) and Weight Loss curve (bottom) for the solvent-based paint. Image Credit: PerkinElmer
The statistics show two significant weight losses at around 110 °C and 460 °C, in addition to a general weight loss between 250 and 350 °C. The IR spectrum in Figure 12 results from the initial weight loss associated with solvent loss.
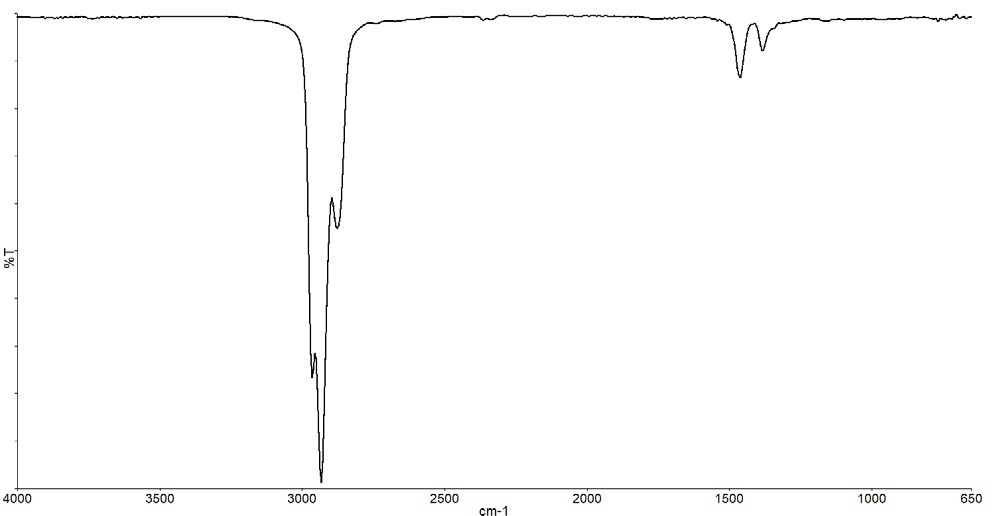
Figure 12. Spectrum from the weight loss at 110 °C. Image Credit: PerkinElmer
Although it is plausible that mixed hydrocarbons were employed, IR cannot conclusively identify the hydrocarbon chain length.
The next component found was identified as phthalic anhydride using a library search (Figure 14), and the broad weight loss event between 250 and 350 °C provides the spectrum displayed in Figure 13.a.
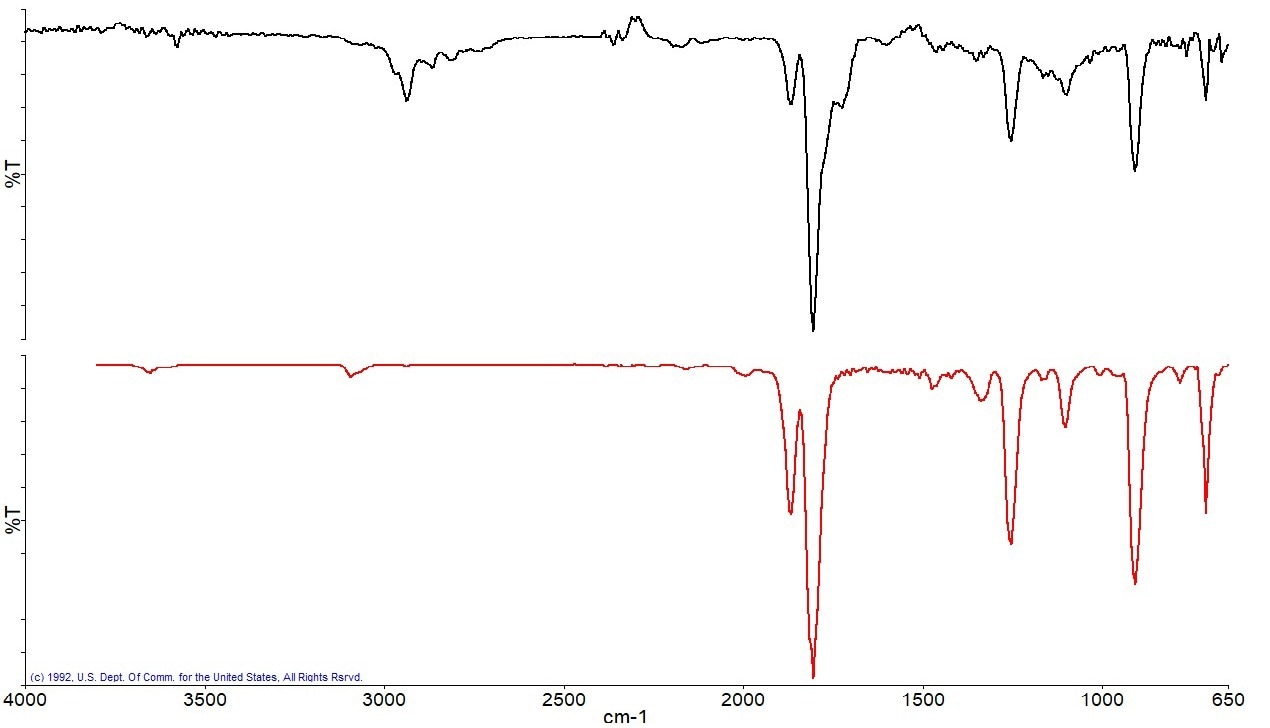
Figure 13a. Spectrum from the weight loss between 250–350 °C (black) and the best library match spectrum (red). Image Credit: PerkinElmer
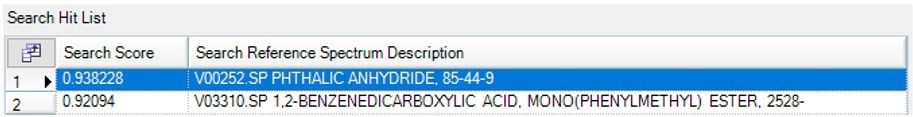
Figure 13b. Search results for the spectrum collected between 250–350 °C identified as Phthalic Anhydride. Image Credit: PerkinElmer
Phthalic acid is frequently employed in solvent-based paints since it creates the alkyd resin, the film-forming component required to coat a surface properly.
The final weight loss results from the breakdown of the components in the paint system, which releases carbon (soot) residue.
When the temperature program was finished, the ATR accessory was used to scan the IR spectrum of the pan residue (Figure 14) and search reference libraries.
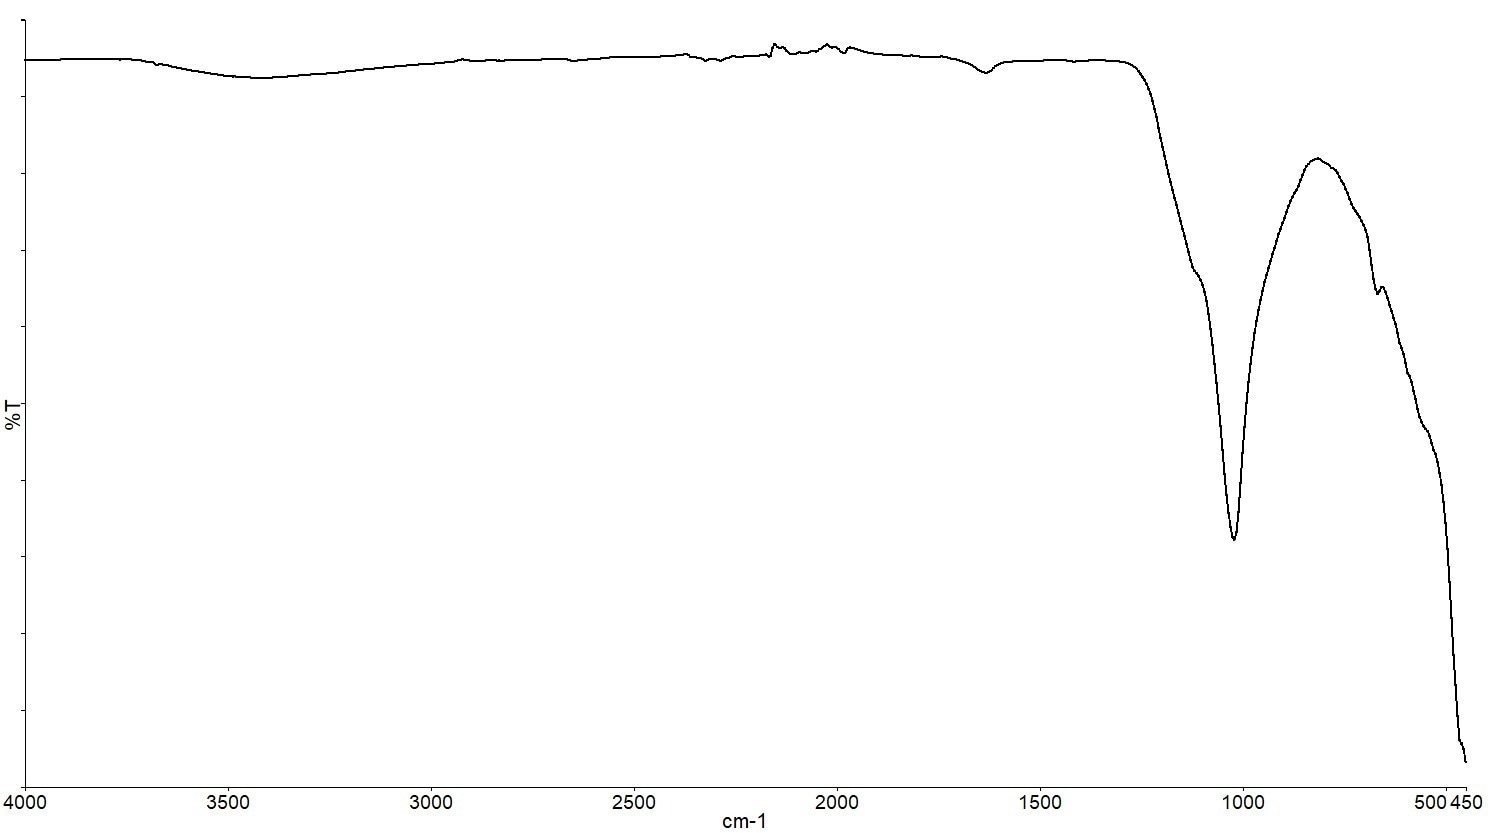
Figure 14. ATR Spectrum of the residue from the solvent paint. Image Credit: PerkinElmer
The material in question is an inorganic compound, but the spectral search could not provide a conclusive identification, most likely because the compound was absent from all of the spectral libraries utilized for the search.
Conclusions
The EGA 4000’s ability to combine the two techniques of thermogravimetric analysis and infrared spectroscopy is an efficient means of identifying the components present in each of the various paint formulations.
The experiments have shown that it is also feasible to estimate the relative amounts of the components, including solvent content and residual solids, based on the individual weight losses. The Spectrum 3’s ability to switch between the ATR and the EGA 4000 provides the paints industry with various analysis options.

This information has been sourced, reviewed and adapted from materials provided by PerkinElmer.
For more information on this source, please visit PerkinElmer.