Thermoplastics are used to make a variety of everyday items. These polymers are distinguished by their ability to soften when heated and harden when cooled. In their molten state, they can be fashioned into various shapes using extrusion, injection molding, and blow molding, among others.
Polymethyl methacrylate (PMMA) is an example of a commonly used thermoplastic. Due to its high transparency, it is frequently used in optical applications such as shatterproof glazing.1
Polymers comprise repetitive units of smaller molecules known as monomers that combine to form long chains. These polymer chains in a molten state or solution include random coils with strong intermolecular interactions through entanglements. As a result, the flow and deformation behavior is complex. Rotational rheometers are commonly used to characterize flow behavior and assess the processability of various plastics.
Polymer melts have a high elasticity due to their structure, which often restricts rheological measurements in a rotational mode where secondary flows and edge fractures can occur. As a result, frequency-controlled oscillatory tests are used to gain insight into the rheological properties of various processing parameters.
According to the equation, Cox and Merz discovered that for linear, unfilled polymers, the dynamic viscosity η as a function of the shear rate ? can be correlated with the complex viscosity |η*| as a function of the angular frequency ω according to the equation (1).2
However, the so-called Cox-Merz rule does not apply to multiphase liquids, such as suspensions or chemically crosslinked and gelled systems.3
| η(?) = | η* | (ω) |
Equation 1 |
To apply this relationship to polymer processing, certain boundary conditions concerning the measurement technique, as well as rheometer performance, must be taken into account. On the one hand, the time needed to pass through one period at a given deformation amplitude defines an oscillatory movement.
Therefore, acquiring rheological data in oscillation could take less than a second, minutes, or even days or weeks, based on the chosen frequency. On the other hand, the maximum frequency of commercially available rheometers is usually limited to around 100 Hz (628 rad/s) by the inertia of the measuring system itself.
To address this problem, the time–temperature superposition (TTS) principle can generate master curves with a broader frequency range. This article offers a guideline for the generation of master curves. It also verifies whether the TTS principle can be applied to a data set by employing the van Gurp-Palmen plot.
Materials and Methods
A Thermo ScientificTM HAAKETM MARSTM iQ Air Rheometer with temperature chamber TM-CR-O450 was used for this research. A polymethyl methacrylate (PMMA) sample was the subject of the investigation. Figure 1 depicts the measurement procedure. All rheological measurements were taken with a parallel-plate geometry with a 15 mm diameter and a 1 mm measuring gap.
A deformation amplitude Y of 0.5 % was chosen within the sample’s linear viscoelastic range. At 180, 200, 220, 240, 260, and 280 °C, frequency sweeps were performed from 300 rad/s to 1 rad/s. Each frequency sweep was performed with a fresh sample to ensure no thermal degradation occurred. Matching sample discs were prepared in advance for all rheological measurements using a HAAKE Minijet Pro Mini Injection Molding System.
Results and Discussion
In an oscillatory shear experiment, the excitation frequency and temperature have a similar effect on the viscoelastic properties of polymers, which means that their behavior at higher temperatures equals their behavior at lower frequencies and vice versa. Figure 2 depicts this phenomenon for the storage modulus G' and loss modulus G" as a function of angular frequency for a PMMA melt at 180 °C, 220 °C, and 280 °C.
G' and G" intersect at an angular frequency of 1.78 rad/s at the chosen reference temperature of 220 °C. PMMA exhibits this crossover at a much higher frequency of 144 rad/s at 280 °C. PMMA, on the other hand, shows no crossover of G' and G" at 180 °C. G' and G" appear to be different parts of the same curve depending on the temperature.
This observation is used when implementing the TTS principle. The individual frequency sweep data sets are shifted horizontally and vertically towards a reference temperature T0 to generate a master curve covering a frequency range much larger than the limited range of a single sweep experiment.
As a result, frequency measurements at different temperatures can gather information about a material’s viscoelastic properties over a wide range of time scales.
The TTS employs temperature-dependent horizontal and vertical shift factors, aT and bT, respectively.5 The horizontal shift factor aT specifies the shift of the measured moduli data along the x (frequency)-axis towards the data set acquired at the reference temperature T0.
The temperature dependence of aT is most commonly described by either the empirical Arrhenius or the William-Landel-Ferry (WLF) models, depending on the polymer’s glass transition.4 Measurement data can also be transitioned towards reference temperatures for which no experimental data is available using these two models.
The vertical shift factor bT is characterized by the density ρ(T) of the polymeric material at a given temperature in comparison to the reference ρ0 (T0), as shown in equation (2).5
 |
Equation 2 |
The temperature-density dependence of entangled polymers is quite small. As a result, vertical shift factors are typically around 1. Even so, data sets can be integrated using bT in such a sense that the optical appearance of the master curve can be impacted, and probable experimental errors can be covered up.5
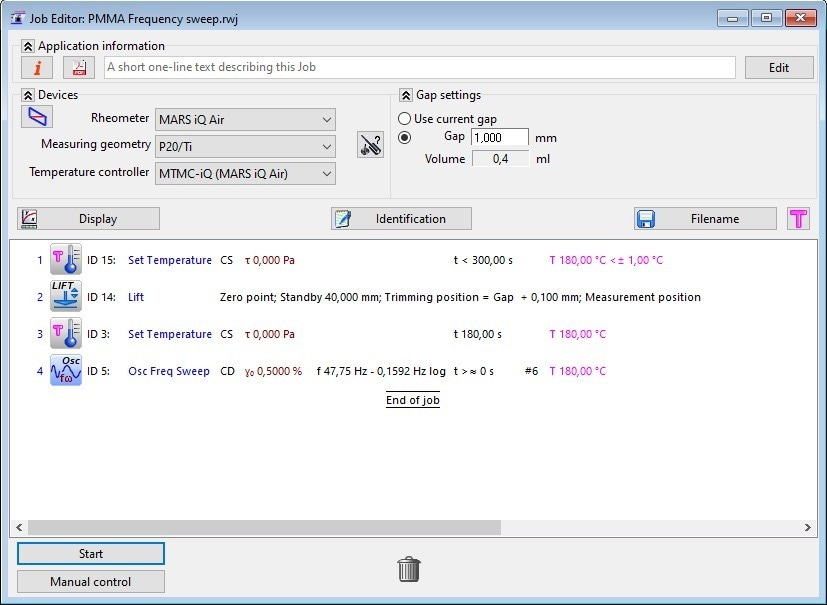
Figure 1. Measurement routine for performing a frequency sweep measurement in the HAAKE RheoWin Software. Image Credit: Thermo Fisher Scientific – Materials & Structural Analysis
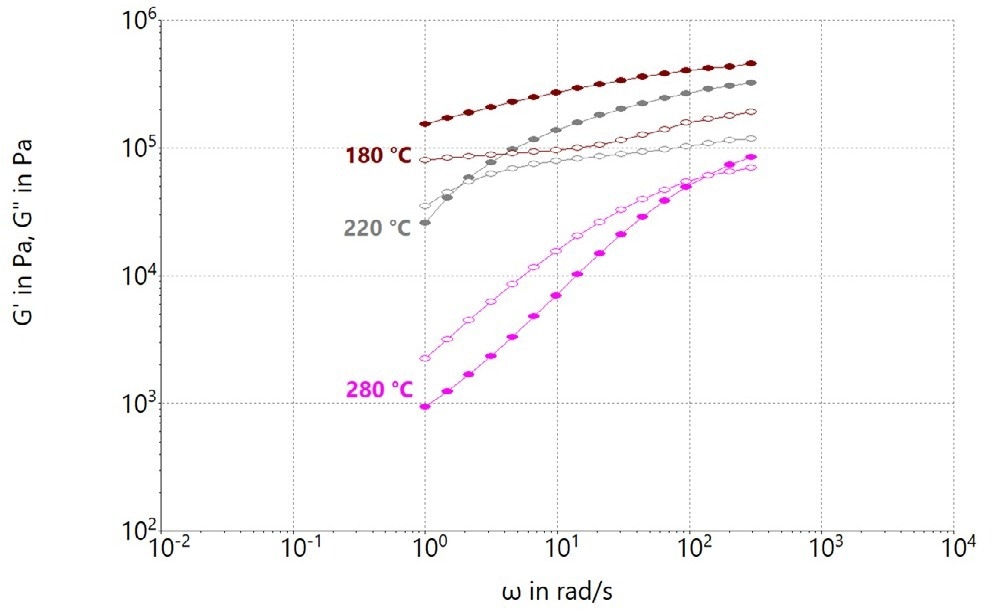
Figure 2. Rheological frequency sweep data at temperatures of 180 °C, 220 °C, and 280 °C for PMMA. Image Credit: Thermo Fisher Scientific – Materials & Structural Analysis
Modern rheometer software, such as the HAAKE RheoWinTM Rheometer Control Software, shifts rheological data and generates master curves to obtain information about viscoelastic properties over a wide frequency range. The TTS principle cannot be applied to thermorheologically complex materials in which two or more relaxation mechanisms have different temperature dependencies.5
The rheological data in Figure 2 were used to generate the PMMA master curve in Figure 3. Additional measurement data was collected at 200 °C, 240 °C, and 260 °C to allow for more overlap and higher precision. The reference temperature was set at 220 °C.
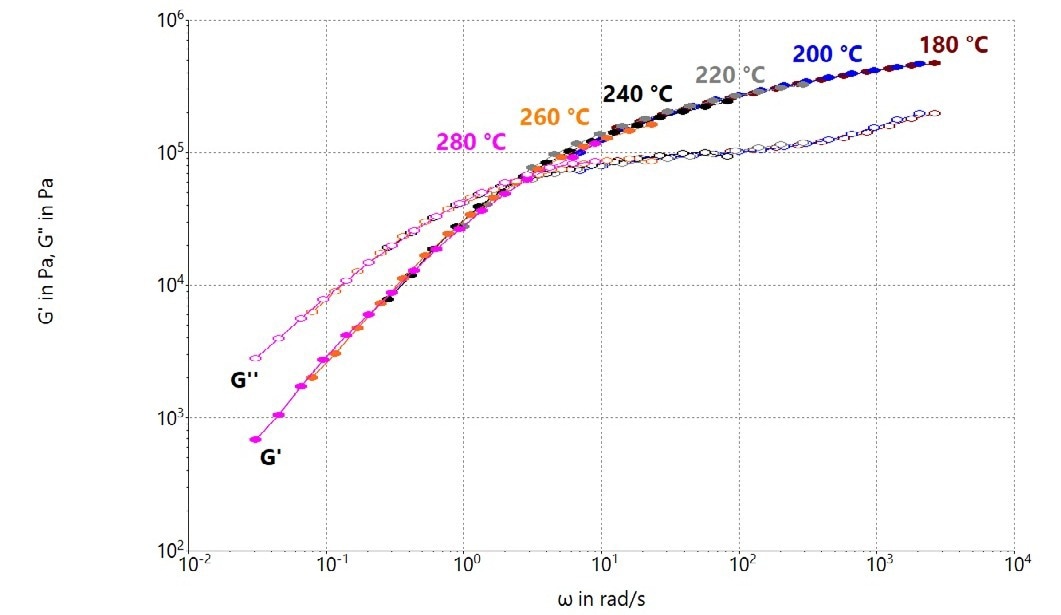
Figure 3. G’ and G’’ master curve at a reference temperature of 220 °C obtained from frequency sweep data at 180 °C, 200 °C, 220 °C, 240 °C, 260 °C and 280 °C for a PMMA melt. Image Credit: Thermo Fisher Scientific – Materials & Structural Analysis
TTS was used to prolong the original angular frequency range of each measurement data set (1 to 300 rad/s) to 0.03 to 2600 rad/s. This range is broad enough to include shear rates encountered in many standard polymer processing techniques, such as extrusion (1...1.000 s-1) and injection molding (10...10.000 s-1).6
The master curve could be lengthened to even higher frequencies/shear rates with additional frequency sweeps at temperatures below 180 °C.
Van Gurp–Palmen disclosed that the phase angle δ as a function of complex shear modulus |G*| for each isothermal frequency sweep used to develop a master curve must superpose into a single continuous curve to ascertain the applicability of the TTS principle for a given polymer fluid.7 Figure 4 depicts the van Gurp–Palmen plot of the individual PMMA frequency sweep measurements.
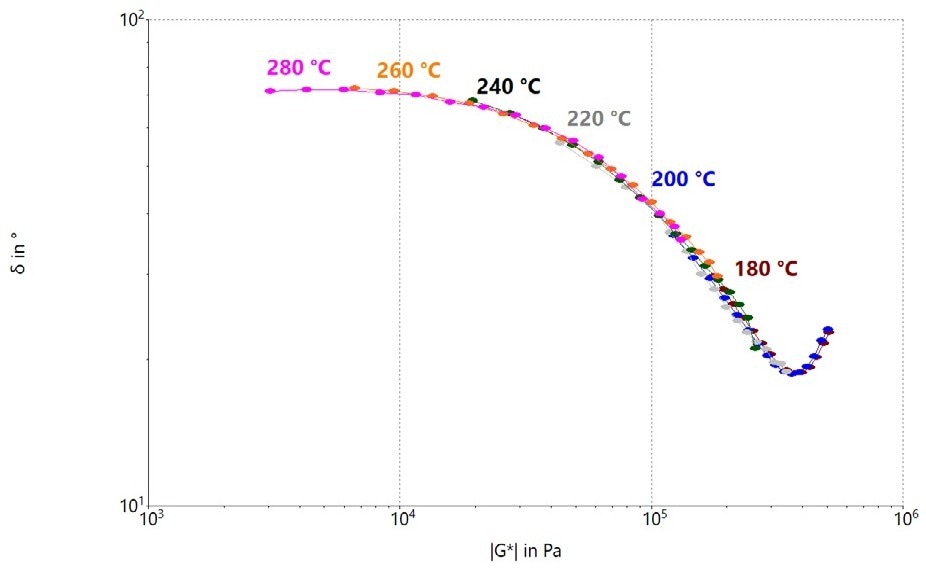
Figure 4. van Gurp-Palmen plot for the single PMMA frequency sweep tests performed at different temperatures. Image Credit: Thermo Fisher Scientific – Materials & Structural Analysis
The van Gurp–Palmen plot can be used to determine whether a polymer sample, such as the PMMA grade used in this study, is thermorheologically simple.
The rheometer software automatically obtains information on the complex viscosity |η*| of the sample based on the G' and G" master curves (3).
 |
Equation 3 |
Numerous material-dependent parameters can be acquired from a master curve for the complex viscosity, using a suitable model fitting, such as the Carreau–Yasuda curve fit described in equation.(4).8
 |
Equation 4 |
In Equation 4, η∞ is the viscosity at an infinite shear rate, η0 is the zero-shear viscosity, and λ is a time constant that represents a characteristic relaxation time of the sample. The power law index n describes shear thinning behavior at high shear rates, whereas the transition factor a refers to the process of polymer chain disentanglement within the polymer network, and the transition from the Newtonian plateau to the material’s shear thinning behavior.
Figure 5 depicts the various Carreau–Yasuda curve fit parameters on an example master curve.
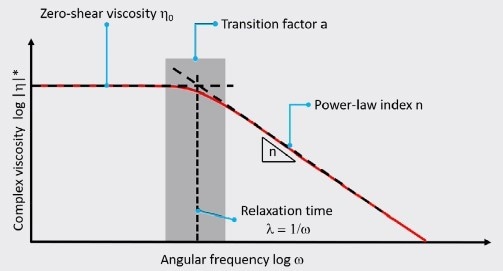
Figure 5. Carreau–Yasuda curve fit parameters illustrated at an example master curve. Image Credit: Thermo Fisher Scientific – Materials & Structural Analysis
A Carreau-Yasuda curve fitting was executed on the complex viscosity data of the master curve to acquire these material-specific parameters for the examined PMMA sample. The master curve was generated, and the curve fitting was performed using the respective HAAKE RheoWin Software functionalities.
The HAAKE RheoWin Software calculated the Carreau–Yasuda parameters for the PMMA master curve at 220 °C, as shown in Table 1.
Table 1. Carreau–Yasuda curve fit parameters for a PMMA master curve at a reference temperature of 220 °C. Source: Thermo Fisher Scientific – Materials & Structural Analysis
| Parameter |
Value |
| η0 |
100.200 Pas |
| λ |
0.81 |
| a |
0.74 |
| n |
0.20 |
The zero-shear viscosity η0 and the transition factor are essential parameters for polymer processing. It is well known that η0 is proportional to a polymer’s average chain length. The distribution of different chain lengths relates to the transition factor. As a result, changes in zero-shear viscosity after processing or recycling can be directly correlated with a polymer’s molecular mass or polydispersity.
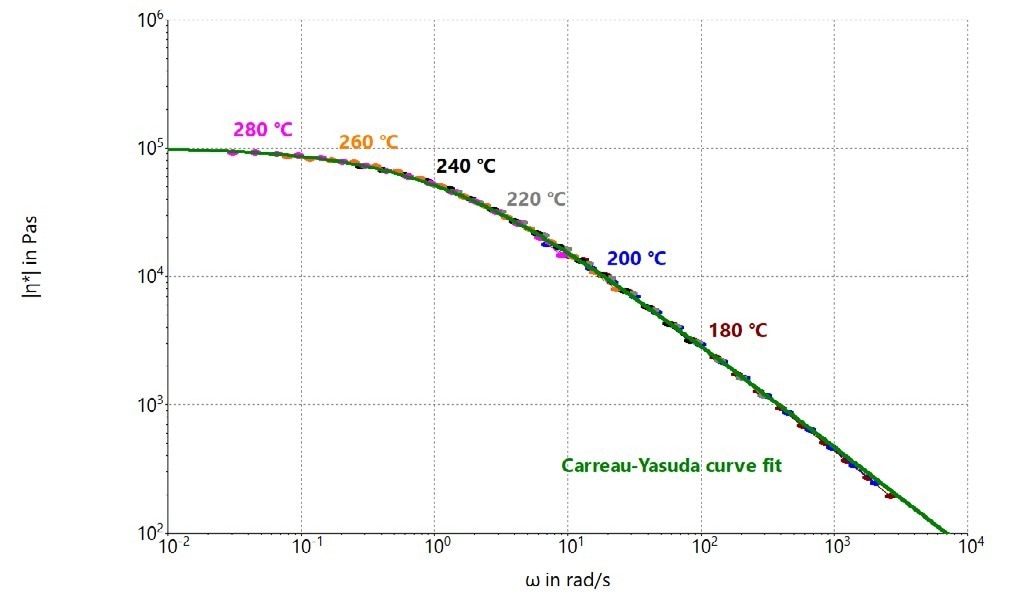
Figure 6. Complex viscosity master curve at a reference temperature of 220 °C obtained out of frequency sweep data at 180 °C, 200 °C, 220 °C, 240 °C, 260 °C and 280 °C for a PMMA melt including Carreau–Yasuda curve fit. Image Credit: Thermo Fisher Scientific – Materials & Structural Analysis
Conclusion
The creation of a master curve from frequency sweep data collected at different temperatures and using the TTS principle for a PMMA sample was outlined in this article. The van Gurp-Palmen plot was developed to provide a quick and easy way to determine whether a set of frequency sweep data is suitable for TTS shifting.
The Carreau–Yasuda curve fitting model was discussed as a method for obtaining various polymer-specific parameters from master curves, which can be used to characterize the effects of different processing techniques or recycling steps on a polymer material’s average molecular mass or molecular mass distribution.
References
- Alger, M–Polymer Science Dictionary (2017)
- Cox, W. P. and Merz, E.H.–Correlation of Dynamic and Steady flow Viscosities–J. Polym. Sci. (1958)
- Geissle, W. and Hochstein, B.–Validity of the Cox-Merz rule for concentrated suspensions–J .Rheol. 47 (4) (2013)
- Dealy, J.M. , Read, D.J., Larson, R.G.–Structure and Rheology of Molten Polymers–2nd edition (2018)
- Plazek, D.–Time-temperature superposition–A users guide – Rheol. Bul. 78 (2) (2009)
- Carnicer, V. et al.–Microfluidic rheology: A new approach to measure viscosity of ceramic suspensions at extremely high shear rates–J. Oceram 5 (2021)
- Van Gurp, M., Palmen, J,–Time-temperature superposition for polymeric blends– Rheol. Bul. 67 (1) (1998)
- Malkin, A. and Isayev, A.–Rheology–Concepts, Methods, and Applications–3rd edition (2017)

This information has been sourced, reviewed and adapted from materials provided by Thermo Fisher Scientific – Materials Characterization.
For more information on this source, please visit Thermo Fisher Scientific – Materials Characterization.