The mechanical behavior of dental composites is a topic of interest to the restorative dentistry field. Therefore, improving the mechanical and tribological properties of fillings and thereby increasing their lifetime through the prevention of filling-fracture, loss of filling, or the generation of secondary caries on the tooth-filling interface are of the highest concern.
Tribological properties are essential when assessing and choosing new dental composite materials, as these properties can directly impact the lifetime of the filling.
Suitable experimental techniques must be sensitive at the macroscale and nanoscale to appropriately portray tribological processes at both levels, delivering a better estimate of real working conditions.
Bruker’s Hysitron TriboIndenter is equipped with a 2D capacitive transducer and in-situ scanning probe microscopy (SPM) imaging, which facilitates ScanningWear and nanoscratch testing.
This article discusses three commercially available dental composites of varying structure, particle size (100s of nanometers to several micrometers) and chemical composition that were investigated using nanoscratch and ScanningWear.
This analysis is of high importance as internal stresses and variations in microstructure generated during the polymerization process are extremely influential on the wear resistance of dental fillings.
Experimental Procedure
10-cycle ScanningWear measurements were conducted over 5x5 μm regions of each dental composite with wearing forces applied of 40 μN, 50 μN, 60 μN, and 70 μN.
The topography of the worn region was obtained using the in-situ SPM method, as displayed in Figure 1.
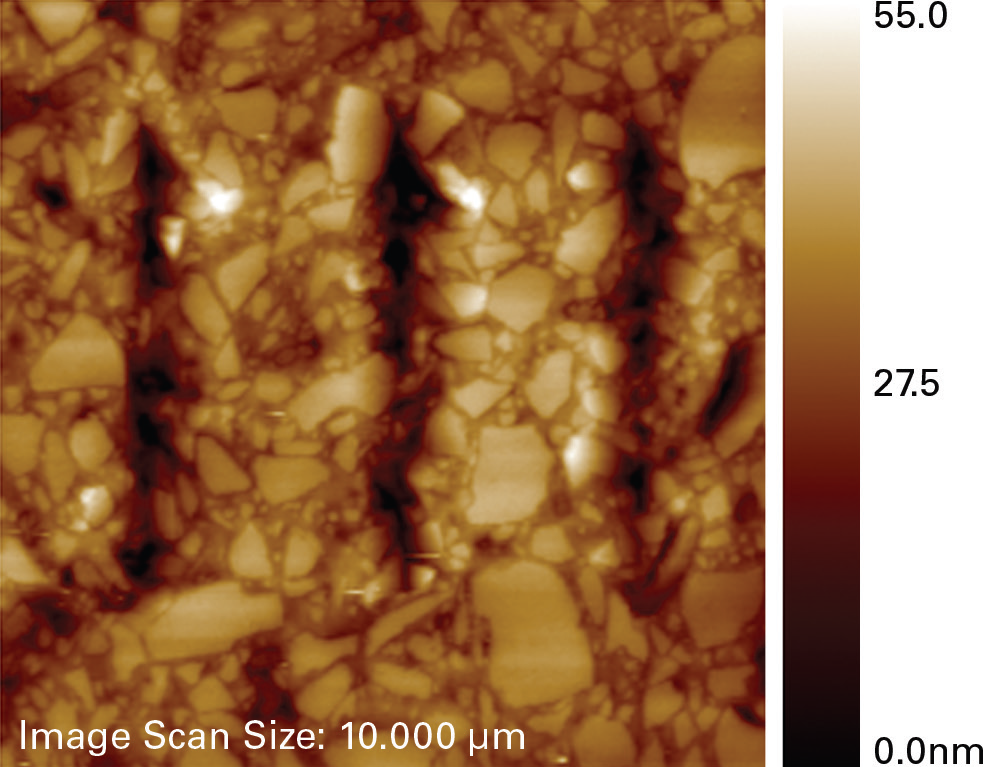
Figure 1. In-situ SPM image of scratch tracks on Sample 1. Image Credit: Bruker Nano Surfaces and Metrology
Wear depth was determined as the difference between the mean height of the surface outside the worn region and the mean height of the bottom of the worn region. This wear depth can be utilized to approximate wear resistance.
Three nanoscratch tests were also conducted at a scratch length of 6 μm, a constant normal force of 800 μN, and a scratch velocity of 0.2 μm/second. For both tests, a Berkovich diamond probe was employed. The scratch probe maintained the same orientation for all measurements.
Results
ScanningWear
According to the determined wear depth, Sample 2 shows the lowest wear resistance over the contact forces range, as shown in Figure 2. Sample 2 exhibits a significant increase in wear depth when the contact force increases from 40 to 50 μN.
However, there was no significant difference in wear depth for the forces 50 and 60 μN for both Sample 1 and Sample 3. Finally, all samples demonstrated a significant increase in wear depth when the contact force shifted from 60 to 70 μN.
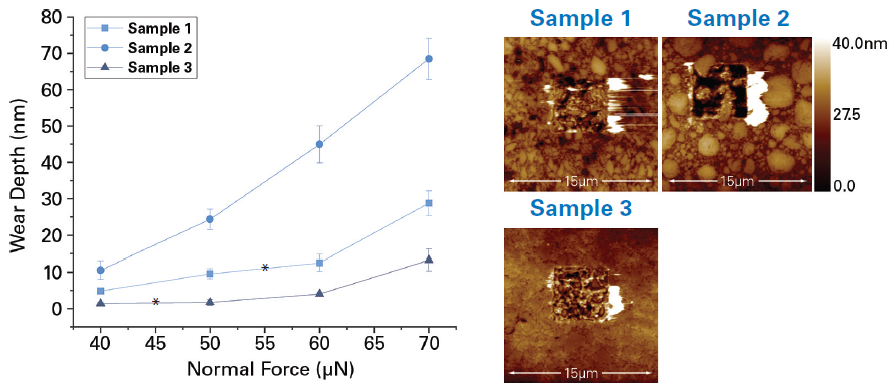
Figure 2. The plot shows the wear depth dependence on a contact (normal) force between a tip and sample surface. In this case, stars (*) indicate the statistically NOT significant differences between data sets of measured wear depth at certain contact forces. Error bars indicate the confidence intervals for mean values of wear depths at a certain normal force. Image Credit: Bruker Nano Surfaces and Metrology
Nanoscratch
Nanoscratch experiments conducted with a normal force of 800 μN offered information regarding the lateral resistance to plastic deformation for the given normal load.
Three scratch tests were carried out for each sample with a standard Berkovich probe with a radius of curvature of approximately 150 nm.
The acquired average measured lateral force for each sample was comparable, not exhibiting any significant differences in scratch behavior. Piezo automation allowed for the exact positioning of the nanoscratch test over a filler particle, as displayed in the image in Figure 3.
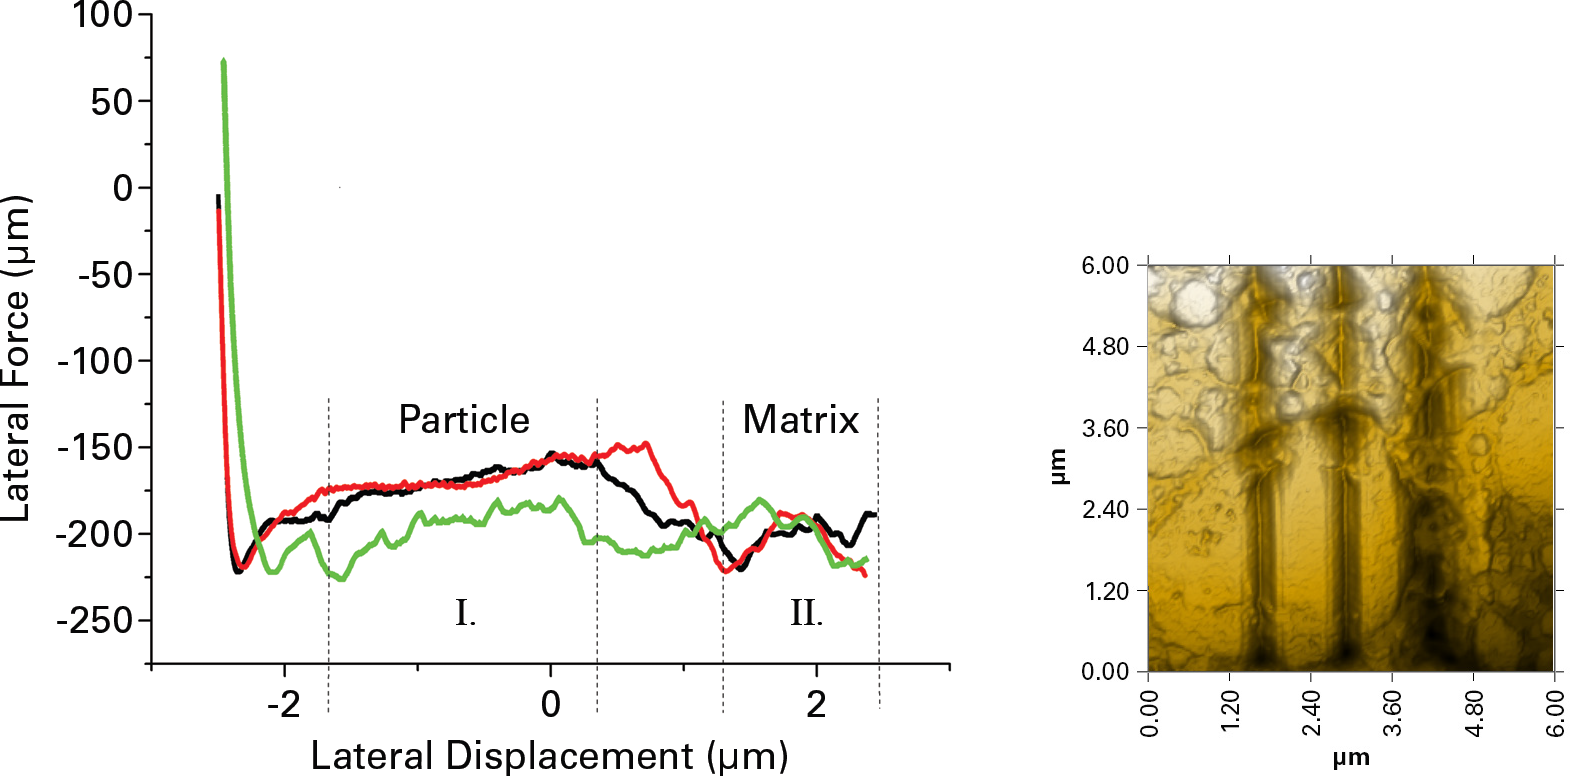
Figure 3. The graph shows recorded values of lateral force representing material resistance to ploughing with a probe: black and red data correspond to the two left-hand scratch tracks in the SPM image. The portions of data in the range I. represents contact with a particle (f=0.16±0.007) and in the range II, contact with matrix (f=0.2±0.01). The in-situ SPM image of Sample 2 displays the scratch tracks resulting from a contact force of 800 μN. Image Credit: Bruker Nano Surfaces and Metrology
The precise test positioning delivered by such automated test routines enabled the characterization of the variation in scratch resistance for individual composite phases. Post-test in-situ SPM images exhibit tribological deformation processes of the functional surfaces in dental composites.
Based on the results for Sample 2, which contained the largest filling particles, it can be seen that the values of lateral force for the particle are slightly lower compared to the value for the matrix, implying less resistance to lateral motion.
Conclusions
The Hysitron TriboIndenter is a powerful tool for examining the tribological behavior of composites at various length scales while mimicking real working conditions. Bruker’s ScanningWear method demonstrated differences in wear resistance among the dental composite samples.
From this study, it is clear that the accurate force-controlled tests combined with in-situ SPM post-analysis of the worn region topography clearly specified critical conditions and proper synthesis processes.
Chemical treatment of the surface of filler particles was also carried out to enhance the mechanical interface between the resin and the filler.
For the highly wear-resistant surface on Sample 1, the surface of quartz particles was modified using a saline layer. This led to a stronger mechanical interface between composite components.
The researchers were also able to observe the tribological properties of individual dental composite components in more detail via nanoscratch testing. The precise positioning function also enabled the scratch characterization of individual phases within the composite, namely polymeric matrix and filler particles.
In-situ SPM imaging can evidently deliver quantitative information regarding deformation mechanisms present in the scratch process.
Acknowledgments
Produced from materials originally authored by Jaroslav Lukeš at Bruker Nano Surfaces and Metrology.

This information has been sourced, reviewed and adapted from materials provided by Bruker Nano Surfaces and Metrology.
For more information on this source, please visit Bruker Nano Surfaces.