Polymer size is an important feature of macromolecules, such as biopolymers, and can be quantified by analyzing measurements of polymer solution viscosity.
The polymer should be dissolved at low concentrations so that the complicating influences of chain entanglements are negligible. As a result of the polymer molecules being isolated in the surrounding solvent, the viscosity enhancement observed in the solution is related only to the size and shape of the individual polymer molecules.
The time taken to drain a fixed volume of the solution through a glass capillary can be measured to determine the viscosity of the polymer.
These measured flow times directly correspond to the liquid viscosity and form the basis for the subsequent calculations leading to the characterization of the dissolved polymer. This measurement method is known as dilute solution viscometry (DSV).
Background
There are multiple calculation methods that may be applied to analyze the measured flow times gained using DSV.
All calculation methods involve the relative viscosity, ηr, which denotes the ratio of the flow times measured for the solution and the solvent i.e., ηr = t/to where t denotes the solution flow time and to denotes the solvent flow time.1
The most valuable methods utilize ηr values measured at various concentrations (c) within the dilute solution region. The subsequent set of concentration values and respective measured relative viscosity values provide a sequence of [c, ηr] data pairs.
Using this data set, a parameter or function can be formed that describes the trend in the data. A second can also be formed that is linked with the limiting value of the dependent variable at an infinitesimal quantity for c.
A straight line that is fit to the data is typically used to describe the trend, and the two determined parameters are the slope and y-intercept, respectively (Bohdanecky and Kovar).
The chosen analysis depends on the expected arrangement of the polymer chain segments and their interactions with the solvent. At the lowest level of complexity, the chain segments are distributed predictably around the molecule's center of mass.
The small solvent molecules are dispersed amongst the chain segments, and the solvent molecules close to the macromolecule’s interior may become entrained in the cloud of chain segments.
To determine the effective size of the macromolecule, the spatial expanse and density (proximity) of the segments can be used, as well as the concomitant development of an amount of entrained solvent.
The effective size is the hydrodynamic volume, modeled as a sphere with a radius, RH. The Huggins equation is frequently chosen to analyze the [c, ηr] data pairs acquired for this type of macromolecule conformation.
Huggins equation for the concentration dependence of the reduced viscosity:
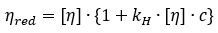
where,  denotes the reduced viscosity, and ηsp denotes the specific viscosity equal to ηr - 1
Here, the reduced viscosity is plotted against concentration and the data is subsequently fit to a straight line where the y-intercept represents the intrinsic viscosity. The Kraemer equation (presented below) is often applied with the Huggins analysis.
Kraemer equation for the concentration dependence of the inherent viscosity:
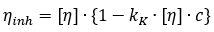
where,  denotes the inherent viscosity
Similar to the Huggins analysis described above, the inherent viscosity is plotted against concentration and the y-intercept of a straight line fit to the data is the intrinsic viscosity, as shown in Figure 1.
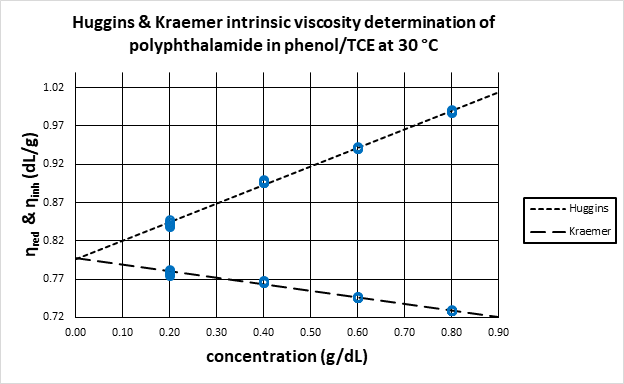
Figure 1. Linear regression of Huggins and Kraemer equations to determine intrinsic viscosity as the y-intercept obtained by extrapolation. Image Credit: Cannon Instrument Company®
Biopolymer Characterization: Measuring Intrinsic Viscosity of Structured Macromolecules
The analysis becomes more complex when certain chain segments correspond to produce molecular structures that change the density and spatial distribution of the segments. The subsequent macromolecules can act as rigid spheres or may adopt an asymmetric shape.
In such cases, analysis of the [c, ηr] data pairs may be conducted using different equations from the Kraemer and Huggins equations.
For instance, considering the analysis of normal human plasma proteins, researchers at the Harvard Medical School (J. L. Oncley) first employed the Kraemer equation. Subsequently, they discovered that a modification of the equation provided a tighter regression.
Oncley’s modification of the Kraemer equation:
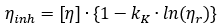
by allowing  in the second term, valid in the limit of infinite dilution
Applying the Kraemer equation to Oncley’s data for Albumin returned [η]=3.49 dL/g with r2 = 0.99378 but plotting inherent viscosity versus ln(ηr) returned [η]=4.18 dL/g with an improved r2 of 0.99995.
During the study of ribonuclease, a biochemist (Schachman) applied the Huggins method but found an improvement by multiplying each side of the equation by concentration:
Schachman’s working equation:
Here, [η] denotes the slope of the regression line at the origin when plotting specific viscosity against concentration.
Researchers at the College of Physicians and Surgeons at Columbia University have proposed a further alternative approach for proteins. Their published paper (Treffers) presented a comparison of the following three trends with concentration: ln(ηr), specific fluidity, and ηsp (the Schachman approach).
The paper concluded, “The utility of the fluidity function is seen from the fact that practically all protein solutions … yield a satisfactory linear plot for the relative fluidity2 against the protein concentration.” This result was confirmed by two following studies that focused on bovine plasma albumin (McMillan).
Specific fluidity equation:
?sp = [η] • c
where  denotes the specific fluidity2
A fitting function through the [c, ηr] data is determined using a plot of ?sp against concentration. Figure 2 presents an example where the [c, ηr] data for β1-globulin in 0.15 M NaCl at 37 °C (J. L. Oncley) was utilized to plot ?sp against concentration and the applied fitting function was a second-order polynomial.
The first derivative of the function evaluated at the origin (x=0) is the slope at infinite dilution. As a result, the intrinsic viscosity, [η]=0.057 dL/g, can be considered, as shown in Figure 2.
![Linear and quadratic equations fit to specific fluidity versus concentration for [c, ?r] data of ß1-globulin in 0.15 M NaCl at 37 °C](https://www.azom.com/images/Article_Images/ImageForArticle_22823_16891411094694537.png)
Figure 2. Linear and quadratic equations fit to specific fluidity versus concentration for [c, ηr] data of β1-globulin in 0.15 M NaCl at 37 °C (J. L. Oncley).
Discussion
The intrinsic viscosity for long flexible macromolecules that do not have a secondary, tertiary, or quaternary structure may be determined via the extrapolation of the [c, ηr] data pairs by applying equations such as the Kraemer and Huggins equations.
For many natural biopolymers, specific interactions within the residues can change the segment distribution and density, leading to a shape change exhibited as altered hydrodynamic behavior.
For these structured macromolecules, an alternative analysis can be used to calculate the intrinsic viscosity from the slope of a regression line for a set of [c, ηr] data pairs.
McMillan concludes his comparison of the intrinsic viscosity determination methods by stating that “the use of specific fluidity regression (slope) is both theoretically sound and less sensitive to experimental error than its alternatives.” However, he adds that it “is appropriate only in circumstances where linearity is demonstrated; in other circumstances, extrapolation methods remain the most appropriate.”
Following the guidance of McMillan, a determination of the slope over just the linear region presented in Figure 2 (see diamond points) provides [η]=0.050 dl/g, which is slightly lower than the value of 0.057 dL/g obtained from the analysis using the quadratic fit (see circle points presented in Figure 2).
In both cases, the integrity of the [c, ηr] data set directly impacts the determination of the intrinsic viscosity.
The Cannon Instrument Company® offers the miniPV series of automated viscometers, which are a valuable resource for the rapid acquisition of [c, ηr] data that is precisely measured.
The viscometers are fully automated, with successive samples in the integrated autosampler being measured only after a programmed cleaning cycle. This follows the previous sample being measured and the tube being purged with compressed air, as shown in Figure 3.
This means the viscometers can be operated unattended, releasing personnel to conduct other important tasks.
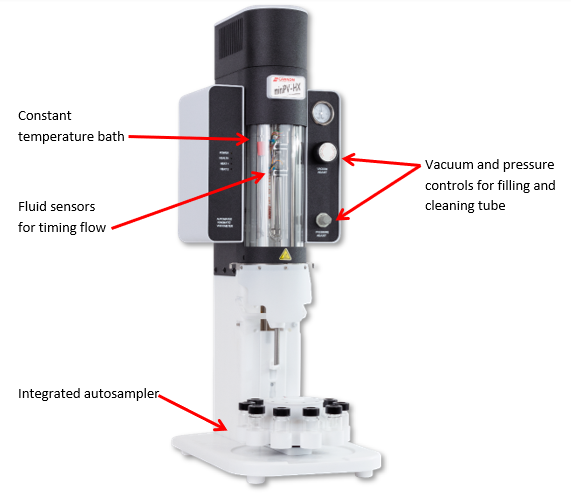
Figure 3. miniPV-HX automated viscometer by Cannon Instrument Company. The instrument maintains a measurement temperature precision of ± 0.01 °C, automatically detects fluid level to start and stop timing of fluid drainage, cleans and dries viscometer tube between each sample solution, and supports ten consecutive sample solutions. Measurement results are recorded in a Microsoft Access3 database. Image Credit: Cannon Instrument Company®
1ηr is defined as the ratio of the solution shear viscosity, η, to the solvent shear viscosity, ηo, such that ηr = η/ ηo. The gravitational viscometer provides a measurement of the kinematic viscosity, ν, which is equal to the shear viscosity divided by the liquid density, ρ, that is ν = η/ ρ such that ηr = (ν/ρ)/ (νo/ρo). For dilute solutions, the density is very similar to that of the solvent. If these are considered to be equal, then ηr = ν/ νo. The kinematic viscosity is acquired using a simple calibration equation for the viscometer: ν = C·t, which may be substituted into the prior equation to give: ηr = (C·t)/ (Co·to). C= Co when the same viscometer is utilized to measure both the solution flow time and the solvent flow time. Then the single viscometer constant, present in both the numerator and the denominator, combines to form unity and as such, we can write ηr = ·t/ to.
2Other researchers refer to specific fluidity instead of relative fluidity. McMillan explains “  may be termed specific fluidity since, like specific viscosity, it is zero at zero solute concentration.” (McMillan)
3Microsoft Access is a trademark of the Microsoft group of companies.
References and Further Reading
- Bohdanecky, Miloslav and Josef Kovar. Viscosity of Polymer Solutions. Alsevier Scientific Publishing Company, 1982. print.
- J. L. Oncley, G. Scatchard, A. Brown. "Physical-Chemical Characteristics of Certain of the Proteins on Normal Human Plasma." Journal of Physical Colloid Chemistry 51 (1947): 184-198. print.
- McMillan, Donald E. "A Comparison of Five Methods for Obtaining the Intrinsic Viscosity of Bovine Serum Albumin." Biopolymers 13 (1974): 1367-1376. print.
- Oliver, D. R. and Stacey G. Ward. "Relationship between Relative Viscosity and Volume Concentration of Stable Suspensions of Spherical Particles." Nature 171 (1953): 396-397. print.
- Schachman, H. K. "Ultracentrifugation, Diffusion, and Viscometry." Methods in Enzymology 4 (1957): 32-103. print.
- Treffers, Henry P. "The Viscosity-Fluidity Relations of Proteins." Journal of Americal Chemical Society 62 (1940): 1405-1409. print.

This information has been sourced, reviewed and adapted from materials provided by Cannon Instrument Company®.
For more information on this source, please visit Cannon Instrument Company®.