Sponsored by PerkinElmerReviewed by Olivia FrostAug 23 2023
Adhesives are a vital component of a diverse range of manufactured goods and have the potential to create new and demanding designs while enjoying universal employment across a wide array of consumer and industrial domains.1
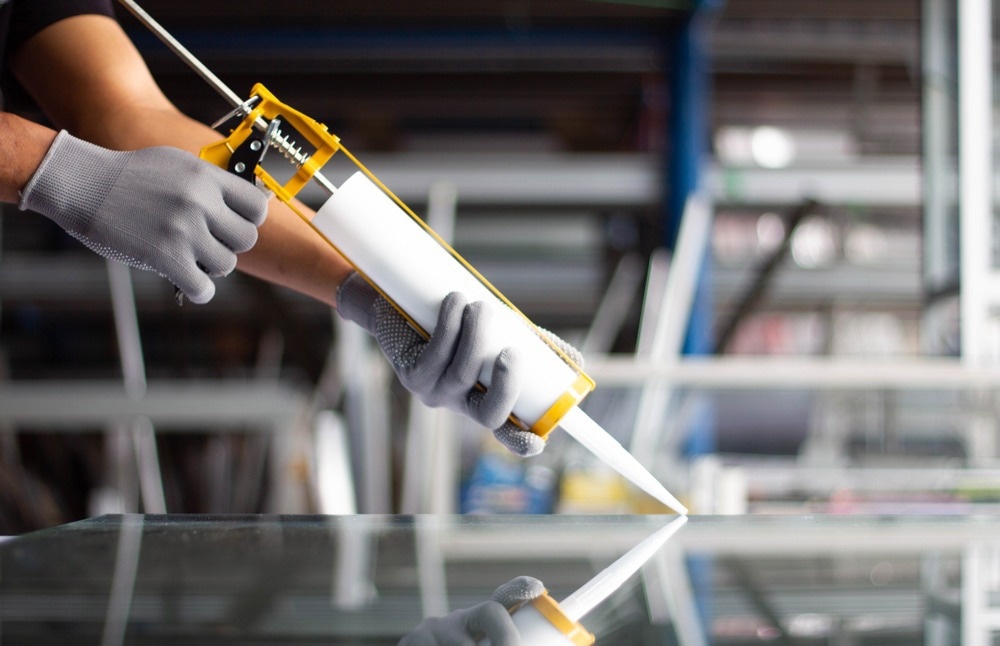
Image Credit: ShutterStock/noprati somchit
Adhesives are typically grouped into five distinct categories — wet, contact, reactive, hot-melt, and pressure-sensitive. Cyanoacrylate adhesives, also referred to as 'superglues,' are single-component reactive agents. They cure upon encountering minuscule traces of moisture on component surfaces, rapidly forging bonds across a variety of materials.
Pressure-sensitive adhesives remain permanently adhesive, establishing connections when pressure is exerted to unite the adhesive with the substrate. Some examples of pressure-sensitive adhesives include adhesive tapes, self-adhesive labels, and films.2
FTIR spectroscopy is regularly employed throughout the adhesives industry for research, identification, and troubleshooting. This article will describe experiments executed on pressure-sensitive, cyanoacrylate, and water-based adhesives.
Experimental
Routine infrared analysis of adhesives can be easily conducted using the PerkinElmer Spectrum Two™ FTIR, which is equipped with a Universal Attenuated Total Reflectance (UATR) accessory, as depicted in Figure 1.
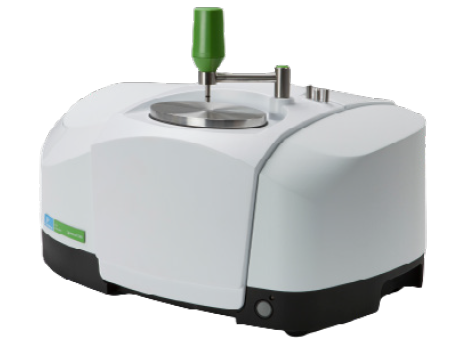
Figure 1. The Spectrum Two FTIR Spectrometer with UATR Accessory. Image Credit: PerkinElmer
Spectra can be recorded by applying a minute quantity of the adhesive onto the diamond ATR crystal. When the sample is a liquid, it establishes optimal contact with the crystal, enabling spectral measurements.
For solid samples, slight pressure is generally applied via the pressure arm to ensure proper contact with the crystal.
A range of adhesives utilized in pressure-sensitive adhesive tapes were evaluated by placing the adhesive side onto the diamond ATR. Figure 2 displays spectra for four such pressure-sensitive adhesives.
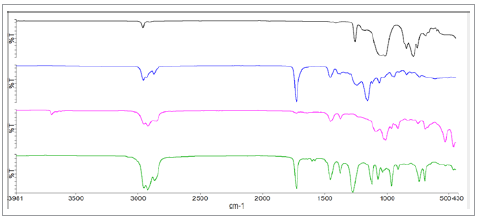
Figure 2. Spectra of different pressure-sensitive adhesives. Image Credit: PerkinElmer
Distinct disparities are evident in the four spectra, revealing the chemical distinctions among the materials. Each adhesive type can be identified using spectral library searches; The Spectrum IR software's search algorithm facilitates swift and straightforward identification, employing either pre-existing commercial adhesive spectral libraries or user-generated libraries.
A search score quantifies the alignment between the spectrum and the library spectra; a perfect match yields a score of 1.00.
Figure 3 shows a recorded tape spectrum alongside its closest match from the spectral library, boasting a Search score of 0.93. This result indicates that the material in question is a commercial pressure-sensitive adhesive.
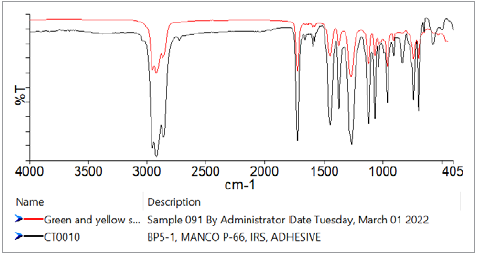
Figure 3. Search result for an adhesive run against a library. Unknown sample (Red), Best library match (Black). Image Credit: PerkinElmer
In the context of adhesive tapes, it is also feasible to determine the polymer type of the tape material by merely flipping the sample and measuring the opposite side.
Water-Based Adhesives
Water-based adhesives are composed of polymer and additive dispersions within an aqueous phase. The curing process occurs as the water evaporates, leaving behind the polymer structure.
When a small drop of such an adhesive is placed on the ATR crystal, an infrared spectrum of the damp adhesive is obtained, primarily exhibiting spectral bands from the water content. Thus, it can be particularly difficult to identify the adhesive if these water bands are present.
However, if the sample is left on the crystal, spectral changes can be observed as the water evaporates.
Figure 4 displays the initial IR spectra recorded right after the sample application, followed by a recording after 20 minutes once the water has dissipated. A library search on the latter spectrum means that the polymer system could be identified as PolyVinylAcetate.
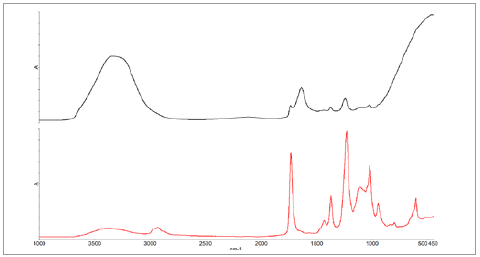
Figure 4. Spectra recorded immediately after sample application (Black) and after 20 minutes (Red). Image Credit: PerkinElmer
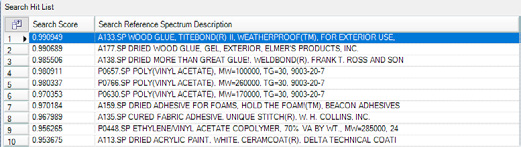
Figure 5. Search result for dried adhesive. Image Credit: PerkinElmer
The curing/drying process could have been continually monitored by employing the Spectrum Timebase software, which would gather spectra at brief intervals throughout the experiment, as mentioned in the forthcoming experimental section.
Monitoring the Curing of a Cyanoacrylate Adhesive
As previously explained, cyanoacrylate glues cure rapidly upon exposure to atmospheric moisture, forming a highly robust bond.
Performing curing experiments on an ATR crystal, such as diamond or other crystalline materials, can lead to the deposition of a substance that presents significant challenges for removal. This coating could potentially cause harm to the valuable ATR crystal when attempting to clean it.
A new and innovative strategy, however, makes use of disposable ATR crystals, which are economical and intended for single use. The Specac Arrow™ Silicon ATR disposable slides, depicted in Figure 6, are ideal for use on the Spectrum Two UATR accessory in such experiments.
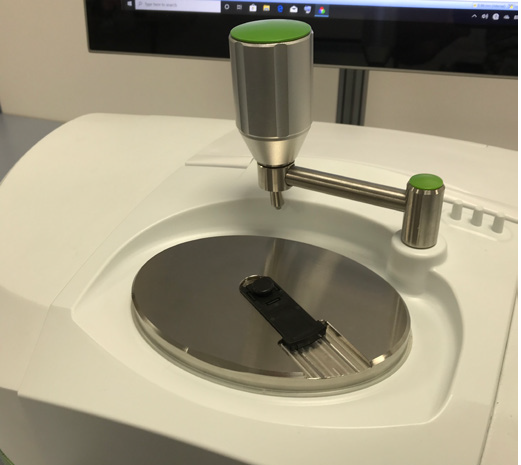
Figure 6. The Specac Arrow Disposable ATR crystal mounted in a Spectrum Two ATR top plate. Image Credit: PerkinElmer
One droplet of adhesive was added to the Specac Arrow ATR crystal. As soon as the adhesive made contact with the silicon ATR crystal, the run was initiated, and spectra was consistently collected every 3 seconds for several minutes.
Throughout this duration, distinct wavenumber profiles were generated to monitor the ongoing chemical transformations until the profiles indicated a cessation of spectral feature alterations, thereby indicating the completion of adhesive curing and the conclusion of the reaction. Figure 7 displays the profiles for 1287 cm-1 and 1241 cm-1.
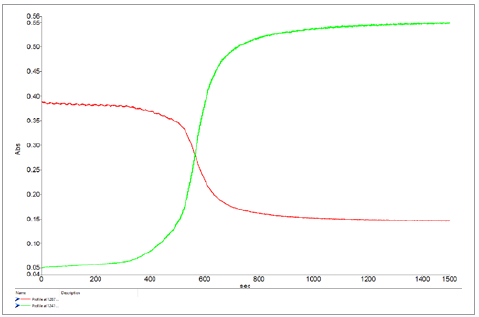
Figure 7. Curing profiles for the cyanoacrylate glue 1287 cm–1 (Red) , 1241 cm-1 (green). Image Credit: PerkinElmer
The spectra of the material exhibit significant spectral changes in the “fingerprint region” during the experiment. Spectra from the beginning and end of the experiment are shown in Figure 8.
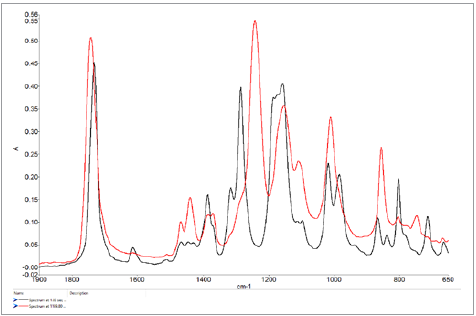
Figure 8. Spectra at start of experiment (black) and end of experiment (red). Image Credit: PerkinElmer
This data illustrates that although superglues establish a rapid bond (in mere seconds), the curing process takes several minutes. After the experiment, the Arrow crystal can be retained if desired or disposed of accordingly.
Conclusions
FTIR has proven to be a highly efficient and straightforward method for analyzing various adhesive types via ATR. This technique facilitates adhesive material identification, even for water-based samples. It also means that researchers can track chemical changes throughout adhesive curing.
Nonetheless, the use of disposable ATR crystals allows for low-cost analysis of particularly tough materials that may cause severe cleaning problems on conventional ATR crystals.
References
- UHU, https://www.uhu.com/en/glue-advice/adhesive-types, April 2022.

This information has been sourced, reviewed and adapted from materials provided by PerkinElmer.
For more information on this source, please visit PerkinElmer.