Integrating near-infrared spectroscopy (NIRS or NIR spectroscopy) in an analysis workflow should pave the way toward realizing a fast, accurate, and non-destructive method for routine analysis. But how can NIR spectroscopy be fully optimized when implemented in your laboratory workflow?
In this article, the steps needed to fully implement a NIR method in the laboratory are described alongside a real-world example.
To start, an assumption of the following points will be made:
- Your business manufactures polymeric material and your laboratory has invested in a NIR analyzer for rapid moisture measurements (as an alternative to Karl Fischer titration) and high-speed intrinsic viscosity measurements (as an alternative to measurements with a viscometer).
- The laboratory has just come into possession of new NIR lab equipment, e.g., a NIRS DS2500 Analyzer.
Establishing moisture levels and the measurement of intrinsic viscosity in a sample are prime examples of quantitative analysis. However, to run these types of analyses using NIR spectroscopy, the creation of a prediction model, or NIR calibration, needs to be the first step.
As displayed in Figure 1, the steps for integrating NIR spectroscopy into the workflow include:
- Creating a calibration set
- Creating and validating prediction models
- Routine analysis
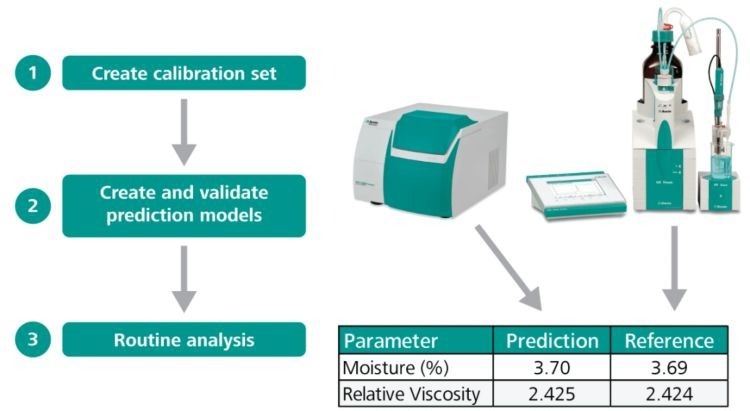
Figure 1. Workflow for NIR spectroscopy method implementation. Image Credit: Metrohm Middle East FZC
Step 1: Create a Calibration Set
NIR spectroscopy is a secondary method. This means that a NIR analyzer must be “trained” using a set of spectra sourced from a primary method that correspond to certain parameter values.
The main methods for evaluating moisture and intrinsic viscosity parameters are Karl Fischer titration and viscometry. In this case, the values from the primary analyses have been acquired.
To ensure the method is robust, the training samples, referred to as ‘calibration set’, must encompass the entire concentration range of the parameters tested. This corresponds with other techniques, such as High-Performance Liquid Chromatography (HPLC), where the calibration standard curve covers the complete expected concentration range. Therefore, if the expected moisture content of a substance should fall into a range between 0.35% and 1.5%, then the samples in the calibration set must be covered by this range.
After the target samples have been measured with the NIRS DS2500 Analyzer, then, using a software program, correlate the NIR results to the values obtained from the primary methods (Karl Fischer titration and viscometry).
For example, using the Metrohm Vision Air Complete software package, simply enter the moisture and viscosity values as shown in Figure 2. Subsequently, the spectral data from the calibration set can be utilized for prediction model development.
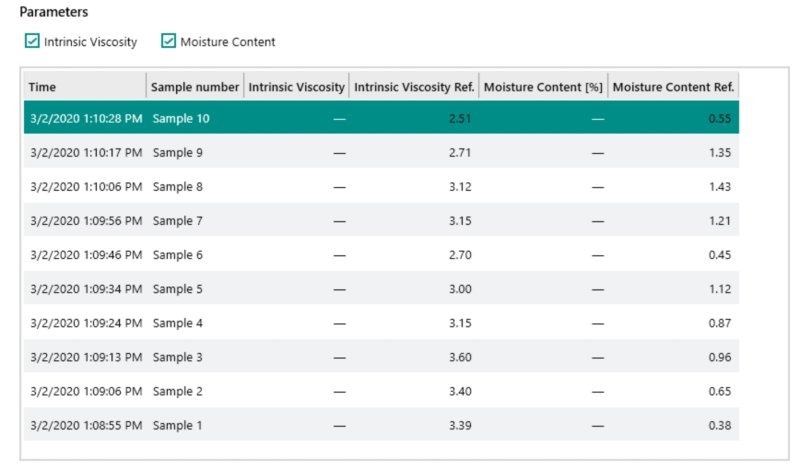
Figure 2. Display in Vision Air Complete of 10 NIR measurements linked with the reference values for intrinsic viscosity and moisture obtained with KF titration and viscometry. Image Credit: Metrohm Middle East FZC
How Many Samples or Spectra are Needed?
The optimal number of spectra in calibration is dictated by the variation in the sample (chemical distribution, particle size, etc.). In this case study, 10 polymer samples were used, which is a good point of departure when checking the feasibility of an application.
However, more sample spectra are required to construct a robust calibration set covering all sample variations that offer a reliable quantitative analysis. The rule of thumb is that between 40–50 sample spectra will help with building a sufficient prediction model in the majority of cases.
This comprehensive data set constructed with 40–50 spectra can be used to validate the prediction model using the Metrohm Vision Air Complete software package. From there, the data set is divided into two groups of samples:
- Calibration set 75%
- Validation set 25%
Step 2: Create and Validate Prediction Models
Creating a Prediction Model
With the calibration set and taking into account the range of expected values, it is time to create a prediction model: This step is known as NIR calibration model development.
The Metrohm Vision Air Complete software package comes with all of the procedures fully developed and built in. Firstly, inspect each NIR spectrum visually to determine regions that change with varying concentrations. Typically, by making a mathematical adjustment, such as the first or second derivative, the visibility of the spectral differences will be enhanced as shown in Figure 3.
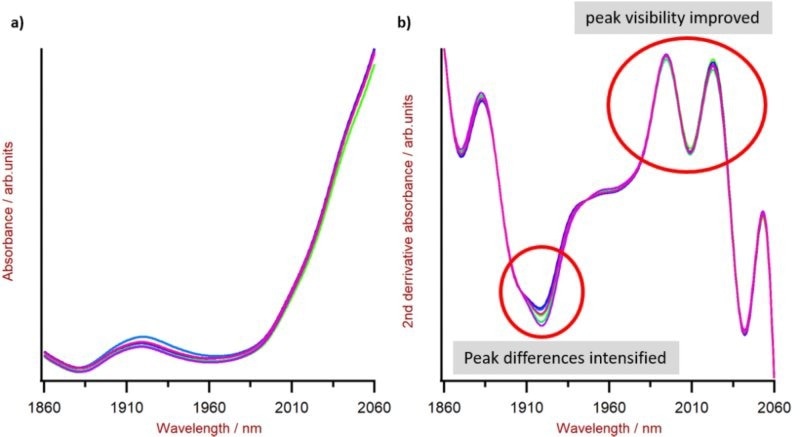
Figure 3. Example of the intensifying effect on spectral information by using mathematical calculation: a) without any mathematical optimization and b) with applied second derivative highlighting the spectral difference at 1920 nm and intensifying the peaks near 2010 nm. Image Credit: Metrohm Middle East FZC
Once the spectral regions have been visually identified, the software attempts to correlate these regions with values taken from the primary method. This produces a correlation diagram that includes the respective figures of merit, i.e., the correlation coefficient (R2) and the Standard Error of Calibration (SEC, precision).
An example of a correlation diagram for moisture can be seen in Figure 4. The same procedure is performed to determine the other parameters, in this instance, intrinsic viscosity.
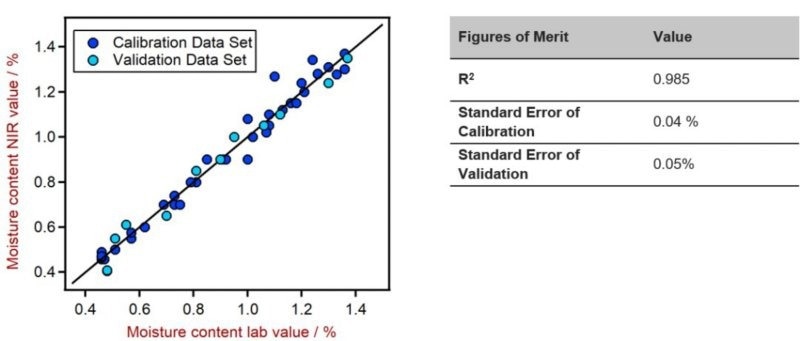
Figure 4. Correlation plot and Figures of Merit (FOM) for the prediction of water content in polymer samples using NIR spectroscopy. The «split set» function in the Metrohm Vision Air Complete software package allows the generation of a validation data set which is used to validate the prediction model. Image Credit: Metrohm Middle East FZC
Univariate vs. Multivariate Data Analysis
The process as described above is similar to HPLC general working procedures. When generating a calibration curve using HPLC, the peak height or peak intensity (surface) is usually correlated with a known internal standard concentration. Here, only one variable is utilized, peak height or surface, therefore, this procedure is referred to as “univariate data analysis”.
Conversely, NIR spectroscopy qualifies as a “multivariate data analysis” technology. NIRS uses a range of the electromagnetic spectrum, for example, 1900–2000 nm for water. Therefore, to generate the appropriate correlation, multiple absorbance values are leveraged.
Validating a Prediction Model
As previously stated, a prediction model is produced using the calibration set, but the validation set will be used to confirm the predictions. Results for these polymer samples are displayed in Figure 4.
Users new to NIR model creation and still building confidence with the system can rely on Metrohm support, which is well known for its high-quality service. Metrohm will guide you through the prediction model creation and validation process.
Step 3: Routine Analysis
The brilliance of near-infrared spectroscopy becomes apparent once the prediction model has been created and validated. It is now possible to run the analysis of polymer samples with unknown moisture content and unknown intrinsic viscosity. With the simple push of a button, the results will be displayed on the NIRS DS2500 Analyzer in less than a minute.
Display Options
Typically, only the results are shown. While the results are highlighted by a yellow or red box to signal a warning or error, as illustrated in Figure 5, the spectrum itself is not displayed.
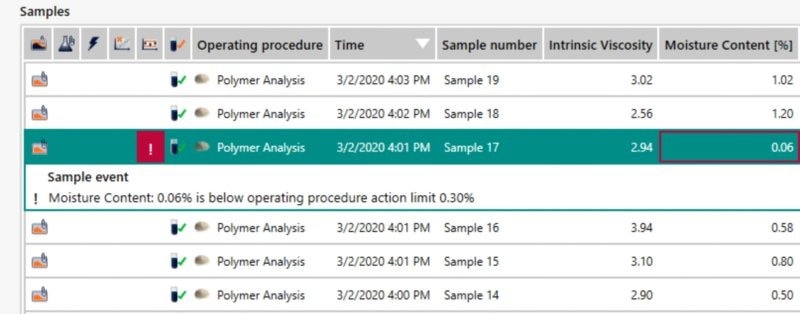
Figure 5. Overview of a selection of results measured with NIR laboratory equipment, with clear pass (no box) and fail (red box) indications. Image Credit: Metrohm Middle East FZC
However, there is the option to display the spectra, but for the majority of users, especially shift workers, these spectra have little to no meaning. In most cases, only the standard numeric values are of any use along with a clear pass/fail indication.
There is also the option to display the trend chart, which can be used for a proactive adjustment of production processes. As shown in Figure 6, warning and action limits are highlighted.
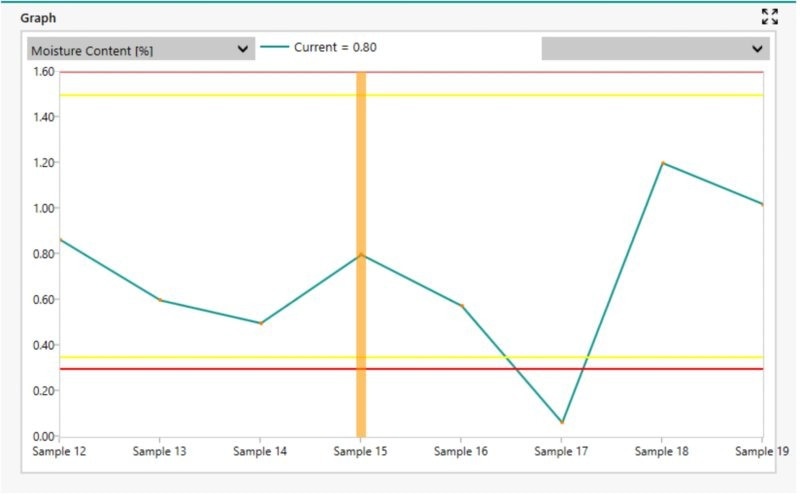
Figure 6. Trend chart of NIR moisture content analysis results. The parallel lines indicate defined warning (yellow) and action (red) limits. Image Credit: Metrohm Middle East FZC
Summary
To successfully implement NIRS in the laboratory, a focus should be placed at the beginning of the workflow, i.e. for the collection and measurement of samples that span the complete concentration range.
The Metrohm Vision Air Complete software package helps facilitate prediction model creation and validation, as well as enabling routine analysis, all of which can be set up and calibrated within a relatively short period. Metrohm NIRS specialists also offer excellent support and can guide new users through prediction model creation if necessary.
There are instances where NIR spectroscopy can be implemented directly without the need for prediction model development by installing Metrohm pre-calibrations. Based on real product spectra, these are reliable, ready-to-use operating procedures for certain applications (e.g., viscosity of PET).

This information has been sourced, reviewed and adapted from materials provided by Metrohm Middle East FZC.
For more information on this source, please visit Metrohm Middle East FZC.