Resolution and signal dispersion in nuclear magnetic resonance (NMR) are related terms often mistakenly used interchangeably. Signal dispersion refers to the extent to which signals are overlapping or separate/distinct, while resolution more accurately refers to the homogenity of the magnet as evidenced by the width of a peak. This is closely related to the line width of the peaks, which depends on T2 (spin-spin relaxation).1
Signal dispersion plays a key role, specifically in hydrogen-1 NMR (1H NMR), due to the small scope of the chemical shift range. Similar to the signal-to-noise ratio, this is directly associated with the magnetic field strength of the NMR spectrometer: the greater the strength of the magnetic field, the greater the signal dispersion. This results in more space between signals in the spectrum, supposing all other variables remain the same. For instance, at 60 MHz, 1 ppm spans 60 Hz, while at 100 MHz, 1 ppm spans 100 Hz, and on a 400 MHz NMR spectrometer, 1 ppm spans 400 Hz, etc.
With J couplings in Hertz remaining constant at different field strengths, in the unifying ppm scale, a multiplet spans a broader region in the spectrum at lower field strengths. Therefore, it is more likely that overlapping with neighboring signals will be observed. This can be easily visualized in the image below, which shows the predicted 1H NMR spectra of 2,2-difluoroethyl p-toluenesulfonate at 60 MHz, 100 and 400 MHz in the Hertz and ppm scale, respectively:
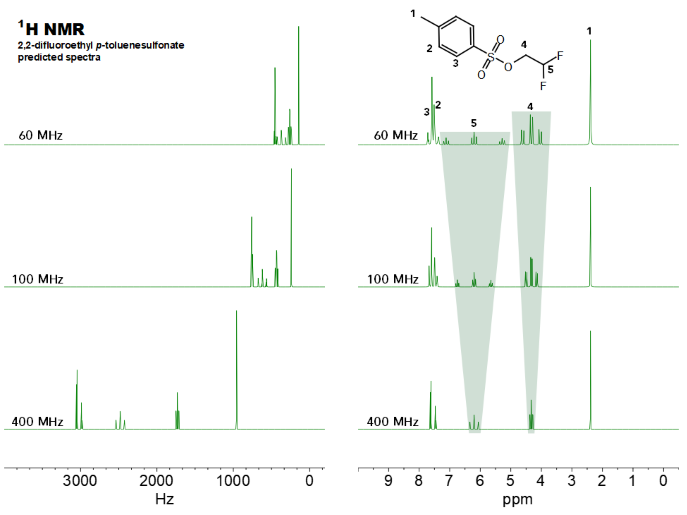
Figure 1. Simulated spectra of 2,2-difluoroethyl p-toluenesulfonate at different field strengths in the Hertz (left) and ppm scale (right). Signals H4 and H5 display the signal dispersion most clearly in spectral overview. Image Credit: Nanalysis Corp.
Why does the distance between two signals matter? Three reasons are set out below:
- Baseline separation of two signals facilitates individual – and more precise – under-curve area integration.
- More complex molecular structures or mixtures of analytes generate multiple signals. The more instances of differentiation, the better the data harvesting.
- Second-order effects are more prominent with lower signal dispersion, introducing more complexity to the spectra.1 Here is a direct 1H NMR spectral comparison of bromobutane at 60 MHz and 100 MHz. The increased signal dispersion at 100 MHz results in complete baseline separation of the methyl group H1 and the methylene group H2. The greater the dispersion, the more it leads to full separation of methylene protons H2 from methylene group H3.
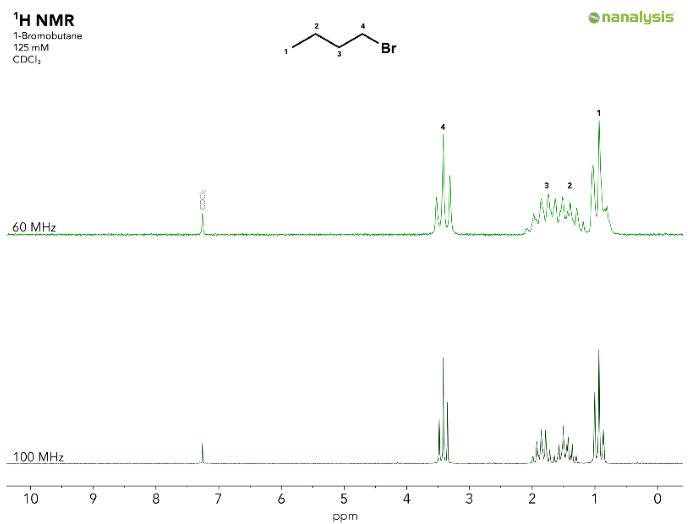
Figure 2. Stacked spectra of 1-bromobutane acquired on a Nanalysis 60 (top) and 100 (bottom). Separation of signals H2 and H3 as well as a lower degree of second order effects are directly related to the signal dispersion. Image Credit: Nanalysis Corp.
While narrower line widths often offer greater precision, signal dispersion limits spectral complexity, enabling accurate spectral analysis. For a more comprehensive analysis of signal dispersion and resolution, Nanalysis has published a paper and infographic.
References and Further Reading
- J. Chem. Educ. 2021, 98, 1227 – 1232. - Incorporating Benchtop NMR Spectrometers in the Undergraduate Lab: Understanding Resolution and Circumventing Second-Order Effects

This information has been sourced, reviewed and adapted from materials provided by Nanalysis Corp.
For more information on this source, please visit Nanalysis Corp.