Sponsored by Park SystemsReviewed by Olivia FrostJun 12 2025
Scanning Electrochemical Cell Microscopy (SECCM) offers enhanced spatial resolution for visualizing electroactivity on surfaces.
Highly Oriented Pyrolytic Graphite (HOPG) is a widely used substrate in Scanning Probe Microscopy (SPM) research, valued for its flatness, uniformity, and well-ordered layered structure. It has served extensively as a model electrode for developing and optimizing electrocatalytic materials and reactions essential to energy conversion processes.1-4
Studying its electrochemical behavior provides valuable insights into the fundamental mechanisms of electrocatalysis, supporting the design of more efficient catalysts across a range of applications.
From a microscopic perspective, the basal plane and step edges of the HOPG surface display heterogeneous electrochemical and electrocatalytic behavior, driven by differences in their electronic and structural properties.5
Traditionally, Scanning Electrochemical Microscopy (SECM) has been used to investigate this electrochemical heterogeneity, enabling the visualization of local electrochemical processes.6 Using a microelectrode probe, SECM measures activity at specific regions, revealing important details about surface electrocatalytic properties.
Compared to SECM, Scanning Electrochemical Cell Microscopy (SECCM) delivers higher spatial resolution, allowing for more localized assessment of electrochemical activity. SECCM employs a small meniscus at the tip of a pipette, functioning as both probe and electrochemical cell, to precisely deliver reactants to targeted surface areas.7-10
In the study discussed here, the electrochemical heterogeneity of HOPG was visualized using a customized SECCM setup developed with Park Systems. This configuration enabled simultaneous acquisition of topographical and electrochemical activity maps.
Grade 2 HOPG was chosen for its intermediate quality, offering a balance between durability and resolution for detailed imaging. Electrochemical maps at various applied potentials were captured using SECCM operated in AC mode, following previously established methods,11,12
Experimental
Chemical and Materials
All solutions were prepared at 25 °C using ultrapure H2O obtained from a Milli-Q water purification system (Millipore Corp., resistivity of 18.2 MΩ·cm). The chemicals utilized, including potassium chloride (KCl) from VWR Analytical, were used as received. HOPG grade 2 (SPI) served as the substrate in the studies.
The ruthenium hexamine redox couple was acquired from Sigma-Aldrich and kept at room temperature before use.
Dual Barrel Probe Manufacturing and Use
Theta borosilicate capillaries (O.D. 1.2 mm, I.D. 0.9 mm) were changed into nanopipettes (I.D. 50-70 nm, O.D. 150-200 nm) using a CO2 laser puller (P-2000, Sutter Instruments). The pipette dimensions were validated by SEM (FEI Quanta 600F).
The pipettes were filled with specified solutions, like 100 mM KCl and 5 mM Ru(NH3)6Cl3. Two Ag/AgCl wires were put into each barrel of the pipette to act as quasi-reference counter electrodes.
SECCM Instrumentation
The dual-barrel SECCM system was based on a Park NX12 AFM model platform11,12 and includes a custom-built potentiostat. The current values from the potentiostat were put into the Aux channel of the AFM controller.
These current readings were critical in ensuring a constant distance between the probe tip and the HOPG sample surface during the SECCM measurements.
To ensure stable SECCM cyclic voltammetry (CV) mapping operations and measurements, a custom-built humidity chamber was used to keep humidity levels between 20 % and 40 %. The SECCM measurement was carried out in partnership with the Baker Lab in the Department of Chemistry at Texas A&M University.
Results and Discussion
The operational principles of SECCM instrumentation have been thoroughly detailed in previous publications by the Unwin group.7-10 The main component is a symmetrically manufactured dual-barrel probe.
At the core of the setup is a symmetrically fabricated dual-barrel probe, which plays a critical role in the system’s functionality.
In SECCM, the electrolyte meniscus acts as a miniature electrochemical cell, and its size, typically in the attoliter range, is closely determined by the dimensions of the probe tip, which generally measures between 150–250 nanometers in outer diameter (Figure 1).
A vertical view of the probe reveals its true shape, displaying a distinct ecliptic structure (Figure 1a and 1b). The dual-barrel probes used in these experiments exhibited a linear ohmic response between the two barrels, confirming their suitability for SECCM measurements (Figure 1c).
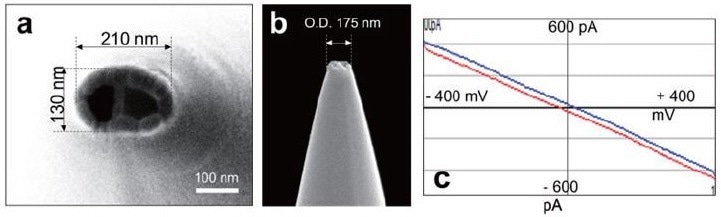
Figure 1. SEM images of the dual barrel probe, a vertical view (a), and a side view (b), which shows the approximate diameter of the probe-tip as 200 nm. The corresponding ohmic response of the dual barrel probe (c) was measured after filling it with 100 mM KCl and applying a potential range of -0.4 V to + 0.4 V. The resulting resistance was determined to be approximately 1 GΩ. Image Credit: Park Systems
To ensure safe and consistent contact between the meniscus and the substrate, which serves as the working electrode, the researchers rigorously checked the ionic current in both DC and AC components. Once the meniscus contacted the substrate, a potential sweep (V1) from 0 to -0.5 V was started to record cyclic voltammograms.
Using a potentiostat, ± V1/2 was applied to two Ag/AgCl electrodes to achieve the necessary potential difference. As a result, the effective potential (Vwe) at the substrate relative to the Ag/AgCl electrodes was around -V1.
The electrochemical current signal (iwe) generated at the working electrode was reliably recorded (Figure 2a) with the AFM's built-in current amplifier.
Two CVs produced at various scan rates were examined, 10 and 50 mV/s, using the Ru(NH3)62+ /Ru(NH3)63+ redox pair via nanoscale cyclic voltammetry, made possible by the dual barrel SECCM setup.
The CVs showed a typical steady-state current pattern for ultramicroelectrodes, and they were almost identical, implying that the electrochemical response stays consistent independent of scan rate (Figure 2b).
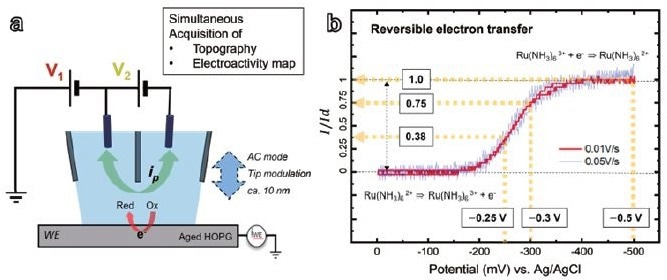
Figure 2. Dual barrel SECCM diagram of the system configuration (a) and SECCM cyclic voltammograms (b) with 5 mM Ru(NH3)6Cl3 (redox couple), 25 mM KCl (reference electrolyte), substrate (WE): HOPG, probe tip diameter: ~ 200 nm, ionic current 24 pA / 100 mV (V2). Image Credit: Park Systems
The researchers were able to obtain simultaneous and correlated SECCM topography and electroactivity pictures of HOPG during reversible electron transfer studies with ruthenium hexamine (Figure 3). The lateral image resolution obtained was the same as the diameter of the twin-barrel probe tip.
This indicates that the electrolyte meniscus did not spread to the substrate surface during the measurement while the applied potential was present. To study potential-dependent electroactivity, measurements were taken at working electrode potentials of -0.25, -0.3, and -0.5 V vs Ag/AgCl.
The findings demonstrated that higher applied potentials resulted in more electroactivity at both the step edges and the basal plane. According to the line profile analysis (Figure 4), the electroactivity varied from 8 to 22 pA (max.) at the step edge and 5 to 15 pA (max.) at the basal plane.
SECCM enabled correlative data processing for characterization of position (or thickness)-dependent electroactivity.
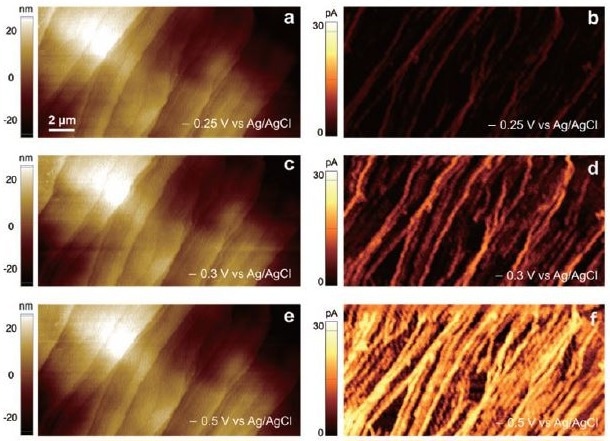
Figure 3. SECCM Topographies (a,c,e) and SECCM electroactivity maps (b,d,f) of HOPG. The reduction of Ru(NH3)63+ of the same area was measured by applying different potentials of - 0.25 V (b), - 0.30 V (d), and - 0.50 V (f) vs Ag/AgCl. The probe diameter was ca. 200 nm and the probe was modulated by 10 nm to operate in AC mode SECCM. 5 mM Ru(NH3)6CL3 was filled into both barrels of the probe with 25 mM KCl as reference electrolyte. Typical acquisition times were xxx s/image. Image Credit: Park Systems
The detailed investigation involved comparing line profiles of thickness and faradaic current at seven different step edges (Figure 4). This method enabled the characterization of the heterogeneous electroactivity, which was expressed as the faradic current per single layer of graphene.
The anticipated number of single graphene layers ranged from six to thirty. The researchers were able to determine the variance in electroactivity at individual step edges on the HOPG surface by directly comparing topography to faradaic current. In addition, strong potential-dependent effects in each local area were found (Figure 4b).
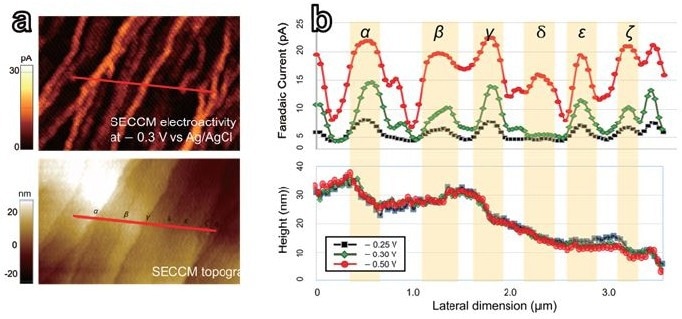
Figure 4. Selected linear area of SECCM electroactivity map (top) and topography (bottom) of HOPG for line profile comparison (a). The line profiles of both were extracted from the red lines above from each at three different potentials of - 0.25 V, - 0.3 V, and - 0.5 V vs Ag/AgCl. (b)correlative profile comparison of selected line data extracted from electroactivity map and corresponding topography at three different potential levels. A total of seven step-edges(α-η) were chosen along the selected line (the red bar in (a)). Image Credit: Park Systems
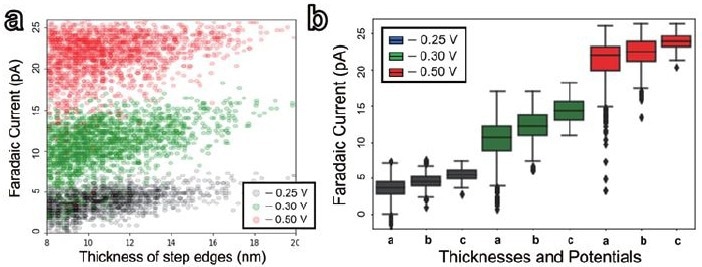
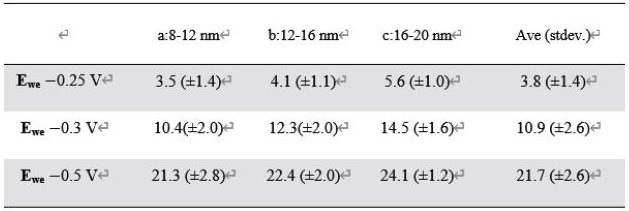
Figure 5. Statistical distribution of the faradaic current at step edges in the range of 8 to 20 nm for three different potentials: - 0.25 V, - 0.3 V, and - 0.5 V vs Ag/AgCl. (a) individual data plots, (b) Box-and-whisker plot depicting the statistical relationship between the thickness of step edges (a: 8-12 nm, b: 12-16 nm, c: 16-20 nm) and three different potentials: - 0.25 V (gray), - 0.3 V (green),and - 0.5 V (red) vs Ag/AgCl. The data are presented in Table 1. Image Credit: Park Systems
Table 1. Statistical analysis of the calculated electroactivity in different thickness levels and potential range. Source: Park Systems
Finally, the electroactivity of step edges on HOPG was studied selectively using statistical analysis. The investigation concentrated on step edges with thicknesses ranging from 8 to 20 nm. The dataset included 1727, 1902, and 1870 data points for the electroactivity map at potentials of - 0.25 V, - 0.3 V, and - 0.5 V, respectively (Figure 5a).
A box-and-whisker plot exhibited a clear trend: as the step edges thickened, the electroactivity increased while the variation in electroactivity decreased. This tendency was constant across all three potentials (Figure 5b, Table 1).
Conclusion
The twin barrel SECCM system has proven to be a helpful tool for electrochemistry researchers due to the use of a custom-designed potentiometer. It enables simultaneous high-resolution topography and electroactivity imaging while effectively confining the electrolyte during applied potential measurements.
This investigation of the model system demonstrated a clear link between higher applied potentials and enhanced electroactivity at both step edges and the basal plane of HOPG. In addition, the examination of thickness-dependent electroactivity provided useful information for calculating the number of individual graphene layers.
This study has shown that dual barrel SECCM is a valuable tool for electrochemistry researchers, allowing for a better knowledge of electrocatalysis and its prospective uses in catalyst creation and energy conversion processes.
Acknowledgments
Produced from materials originally authored by Myung-Hoon Choi, Hanaul Noh, Lane A. Baker, and Stefan B Kaemmer from Park Systems Inc.
References
- Banerjee, S., et al. (2005). Conductivity landscape of highly oriented pyrolytic graphite surfaces containing ribbons and edges. Physical Review B, 72(7). https://doi.org/10.1103/physrevb.72.075418.
- Ma, H., et al. (2014). Scanning Tunneling and Atomic Force Microscopy Evidence for Covalent and Noncovalent Interactions between Aryl Films and Highly Ordered Pyrolytic Graphite. The Journal of Physical Chemistry C, 118(11), pp.5820–5826. https://doi.org/10.1021/jp411826s.
- Pham, K.D., et al. (2018). Layered graphene/GaS van der Waals heterostructure: Controlling the electronic properties and Schottky barrier by vertical strain. Applied Physics Letters, 113(17), p.171605. https://doi.org/10.1063/1.5055616.
- Zhang, Y., Ren, J., Zhang, X., He, Y., Zhang, Z., Fan, J., Wang, Z. and Qu, X., 2020. Multiscale Superstructures via Self‐Assembly of DNA Origami and Abiotic Nanoparticles. Angewandte Chemie International Edition, 59(13), pp.5357–5361. https://doi.org/10.1002/anie.201910514
- Jaouen, K., et al. (2017). Localized electrochemistry for the investigation and the modification of 2D materials. Applied Materials Today, (online) 8, pp.116–124. https://doi.org/10.1016/j.apmt.2017.05.001.
- Nikoloz Nioradze, Chen, R., et al. (2015). Organic Contamination of Highly Oriented Pyrolytic Graphite As Studied by Scanning Electrochemical Microscopy. Analytical Chemistry, 87(9), pp.4836–4843. https://doi.org/10.1021/acs.analchem.5b00213.
- Snowden, M.E., et al. (2012). Scanning Electrochemical Cell Microscopy: Theory and Experiment for Quantitative High Resolution Spatially-Resolved Voltammetry and Simultaneous Ion-Conductance Measurements. Analytical Chemistry, 84(5), pp.2483–2491. https://doi.org/10.1021/ac203195h.
- Patel, A.B., et al. (2012). A New View of Electrochemistry at Highly Oriented Pyrolytic Graphite. Journal of the American Chemical Society, 134(49), pp.20117–20130. https://doi.org/10.1021/ja308615h.
- Chi, S., et al. (2012). Definitive Evidence for Fast Electron Transfer at Pristine Basal Plane Graphite from High-Resolution Electrochemical Imaging. Angewandte Chemie International Edition, 51(22), pp.5405–5408. https://doi.org/10.1002/anie.201200564.
- Zhang, J. and Kim, B. Park AFM Application Note #48
- Choi, M., et al. (2020). Probing Single-Particle Electrocatalytic Activity at Facet-Controlled Gold Nanocrystals. Nano Letters, 20(2), pp.1233–1239. https://doi.org/10.1021/acs.nanolett.9b04640.
- Jeong, S., et al. (2022). Unraveling the Structural Sensitivity of CO2 Electroreduction at Facet-Defined Nanocrystals via Correlative Single-Entity and Macroelectrode Measurements. Journal of the American Chemical Society, 144(28), pp.12673–12680. https://doi.org/10.1021/jacs.2c02001.

This information has been sourced, reviewed and adapted from materials provided by Park Systems.
For more information on this source, please visit Park Systems.