Rheology is the science of material flow and deformation, studying the transformation of fluids to solid-like materials and any state in between. Measurements of flow and deformation are frequently used in the investigation and induction of bulk physical material changes, such as crystallization, gelation, melting, or polymerization.
Key to this is Raman spectroscopy, a vibrational spectroscopic technique able to provide useful chemical and morphological insight into these processes at the molecular level.
Raman studies were largely conducted ex situ until very recently, with Raman spectra acquired before and after an observed physical transformation.1
This approach often left the true chemical and morphological changes driving these processes uncaptured, leaving significant room for data interpretation and speculation around these dynamic physicochemical relationships.
The HAAKE™ MARS™ Rheo-Raman system (Figure 1) from Thermo Scientific™ is a fully integrated system that facilitates simultaneous rheology and Raman spectroscopy measurements.
This powerful new system combines two distinct Thermo Scientific instruments: the HAAKE MARS Rheometer and a DXR3 Flex Raman Spectrometer.
The HAAKE MARS Rheo-Raman system has been specifically developed to enable straightforward real-time, in situ measurements of both physical and chemical–morphological properties.
This type of multimodal analytical tool offers many benefits over the conventional ex situ approach. For example, combining multiple one-dimensional experiments significantly enhances data collection efficiency. Performing both techniques simultaneously preserves sample fidelity while capturing the material’s transformation in real time.
A multimodal tool also reduces sample consumption, which is a considerable benefit when developing new materials or formulations using limited quantities of potentially expensive samples.
This article explores the use of the Rheo-Raman system in investigating the temperature-dependent melting and crystallization of polypropylene and outlines its use in examining the isothermal crystallization process.
The Rheological Behavior of Polypropylene
Melt and crystalline phase transitions generally correlate with variations in viscous and elastic behavior observed during the rheological analysis of polymeric materials.
These phase transitions tend to be associated with spectral pattern changes in characteristic Raman peaks acquired during spectroscopic analysis.
It is often difficult to perform and compare measurements acquired ex situ due to subtle deviations in sample composition, temperature control discrepancies, and differences in processing history.
The in situ Rheo-Raman system eliminates these discrepancies, improving the validity of analysis in melt and crystalline phase transitions at the macroscopic and molecular levels.
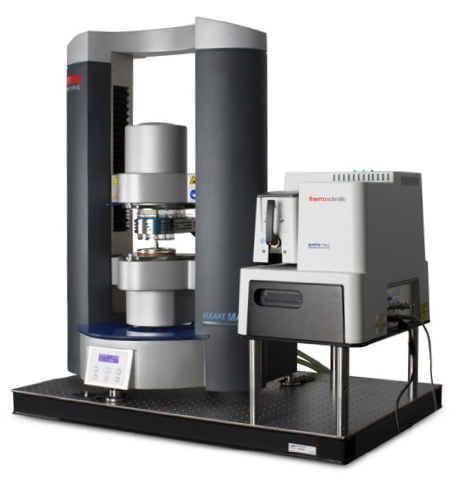
Figure 1. The HAAKE MARS Rheometer and DXR3 Flex Raman Spectrometer comprise the Rheo-Raman system. Image Credit: Thermo Fisher Scientific – Materials Characterization
Materials and Methods
Materials
This study used polypropylene pellets (Ineos Olefins and Polymers, USA, R12C-00 random copolymer). To prepare the pellets for testing, they were first melted on the rheometer at 190 ºC to form a continuous, disk-shaped specimen.
Rheometer
Rheological measurements were acquired using the HAAKE MARS Rheometer. This instrument was fitted with a 20 mm diameter stainless steel parallel-plate rotor.
All measurements were conducted in the oscillatory mode in order to extract the polypropylene’s viscoelastic behavior. Oscillatory measurements were done at one Hz with a constant strain of 0.1 %, with data collected every five seconds.
All samples were initially loaded at 190 °C in order to soften the polypropylene (PP) and allow this to better conform to the measuring geometry. The temperature was decreased from 190 °C to 30 °C, at a rate of 5 °C per minute, for the melt-to-crystallization phase transition study.
Isothermal crystallization studies at 138 °C and 150 °C required the temperature to be rapidly decreased from 190 °C to 10 °C above the target temperature. Next, the temperature was slowly decreased until it reached the test temperature of 138 °C or 150 °C before being held constant for a maximum of one hour (3600 seconds). The isothermal recrystallization process was observed during this window.
Spectrometer
The DXR3 Flex Raman Spectrometer was used to collect Raman spectroscopy measurements. This instrument features a 532 nm, 10 mW laser and a triplet spectrograph able to acquire Raman spectra over the range of 3500 to 50 cm-1 Raman shift (Stokes) at 5.0 cm-1 resolution. It also features a CCD camera cooled to -50 °C.
Software was used to control alignments in the spectrometer of the laser, Raman scatter, and aperture selection. A 0.1 second minimum exposure time was used, though the data presented in this article was collected with an exposure collection time of four seconds and two sample exposures averaged per spectra collection.
RheoRaman Coupling
The HAAKE MARS RheoScope Module (Figure 2) was used to couple the Raman spectrometer (DXR3 Flex Raman Spectrometer) and rheometer (HAAKE MARS Rheometer).
The DXR3 Flex Raman Spectrometer was free-space coupled to the rheometer using an optical train, using two plane mirrors to direct the incident laser into the RheoScope Module.
A series of mirrors within the RheoScope Module directs the laser beam into a 20x objective, which sees the laser light focused through a 2 mm thick fused silica window into the sample. This is done either perpendicularly to the flow or vorticity plane.
Raman scattered light is then collected in a 180 º backscatter geometry via the same 20x objective before being guided back to the spectrometer via the same optical train as the incident laser. Scattered light eventually reaches the spectrograph inside the spectrometer via this route.
Free-space coupling of the laser to both the rheometer and the DXR3 Flex Raman Spectrometer facilitates straightforward Raman excitation laser wavelength interchange, allowing the laser’s wavelength to be optimized to the sample. There are 785 nm and 455 nm laser sets also available.
The sample must be positioned between the silica window, and the rotor geometry must be attached to the rheometer measuring head (Figure 2) to perform a measurement. It is also possible to adjust the objective for interrogation at different penetration depths within the sample, and position this at different radial locations along the optical slit from the sample’s true center to its outer edge.
An electrical heating element is placed below the fused silica window in order to allow appropriate temperature control during testing. Cooling was possible due to the use of a temperature-controlled circulator with a 50:50 mixture of water and ethylene glycol.
The Thermo Scientific OMNIC™ Software and RheoWin™ Measuring and Evaluation Software were used to control all instrumentation.
The electric heater allows a minimum temperature of -5 °C and a maximum temperature of 300 °C, with a maximum heating and cooling rate of 10 °C per minute. Temperature control from above was possible due to the use of an active electrical hood, removing the potential for a temperature gradient within the sample (Figure 2).
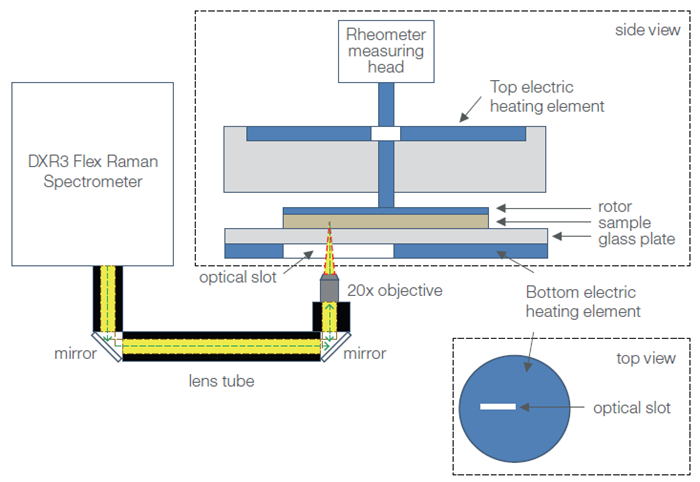
Figure 2. Schematic diagram of the Rheo-Raman system (showing side and top views of the rheometer sample stage). The DXR3 Flex Raman Spectrometer is free-space coupled to the HAAKE MARS Rheometer using plane mirrors that direct light into a 20x long, working distance objective. The objective focuses the incoming laser (green dashed line) and collects the back-scattered Raman light (yellow) coming into and out of the sample (which sits atop the rheometer stage). The optical path from the spectrometer to the rheometer is enclosed in lens tubes (black). The optical slot in the bottom heating plate permits passage of the laser beam and scattered Raman light. Image Credit: Thermo Fisher Scientific – Materials Characterization
Results and Discussion
Polymer processing relies on the effective management of physicochemical and morphological relationships during polymer crystallization. This experiment successfully used the new MARS Rheo-Raman system to investigate polypropylene’s (PP) crystallization process.
Figure 3 shows representative Raman spectra for PP at three different temperatures. The spectrum at 53 °C generally showed sharp peaks across the examined spectral range, with these sharp spectral features suggesting the high degree of conformational order that is typically indicative of crystalline and semicrystalline structures.
Increases in temperature to 120 °C and 173 °C saw these peaks begin to broaden and merge. The broadening of spectral peaks in this way is widely attributed to melt behavior in polymeric materials.
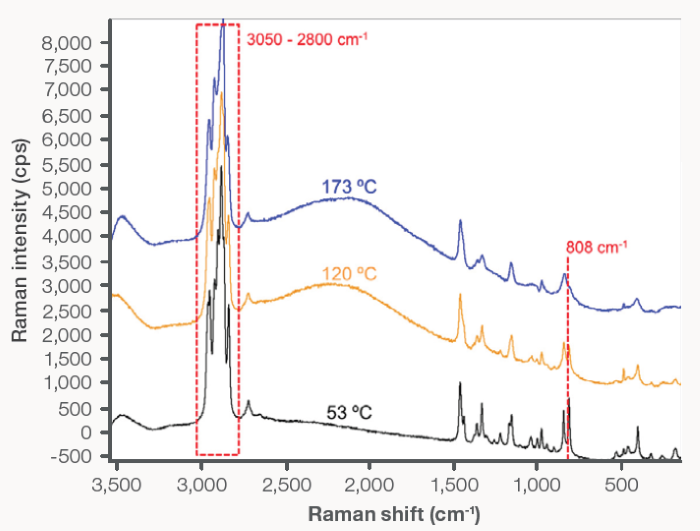
Figure 3. Raman spectra for PP: (black) 53 °C, (yellow) 120 °C, and (blue) 173 °C. The dashed line at 808 cm-1 and dashed box from 3,050–2,800 cm-1 indicate relevant Raman bands that are relevant to recrystallization of PP. Image Credit: Thermo Fisher Scientific – Materials Characterization
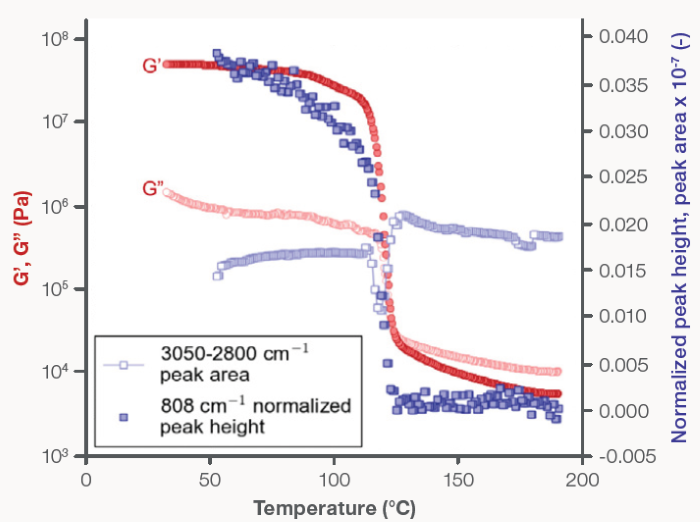
Figure 4. PP recrystallization: (filled circles) G’ and (open circles) G”, plotted on the left y-axis, and (filled squares) the normalized 808 cm-1 Raman shift peak height and (open squares) the 3,050–2,800 cm-1 peak area, plotted on the right y-axis, are a function of decreasing temperature from 190 to 30 °C. Image Credit: Thermo Fisher Scientific – Materials Characterization
Skeletal deformation of helical chains within the crystal (808 cm-1 peak) and the CH stretching region (3050–2800 cm-1 spectral range) are known to be specific indicators in the Raman spectra for PP.
The intensity of the 808 cm-1 peak demonstrates PP’s crystallinity, while the CH stretching region’s intensity is used as a measure of overall Raman scattering intensity during the crystallization process.2
The 808 cm-1 peak height was also normalized by the peak area between 880 cm-1 and 780 cm-1, with the 880 cm-1 to 780 cm-1 spectral region containing skeletal chain vibrations of all conformations during the melt-to-recrystallization process.
Spectral features in the 3050 cm-1 to 2,800 cm-1 range were also integrated into a total peak area.2
Normalized helical chain vibration peak height and overall CH stretching peak area were tracked throughout the melt-to-crystalline phase transition before being overlaid with in situ rheology data (Figure 4).
Rheological probing of PP’s melt and recrystallization process was conducted via small amplitude oscillatory shear measurements (Figure 4), with the storage modulus (G’) and loss modulus (G”) measured as a function of temperature.
G’ and G” are measures of the elastic and viscous behavior of a material, respectively. For instance, a liquid-like material will be more viscous than elastic (making it viscously dominated, prompting G” to be greater than G’. A solid-like material will display more elastic than viscous behavior, however, making this elastically dominated) and prompting G’ to be greater than G”.
At high temperatures (above 150 °C), G” was consistently greater than G’, indicating that the PP specimen was in a molten state and behaving like a liquid.
As the temperature dropped from 150 °C to 100 °C, a sharp and significant increase in both G’ and G” occurred around 125 °C. By the time the temperature reached 100 °C, G’ had risen by four orders of magnitude, while G” increased by two orders of magnitude.
This range, from 150 °C to 100 °C, marks the melt-to-crystalline transition region for this PP material. Below 100°C, G’ became more than an order of magnitude greater than G”, clearly signaling that the material had transitioned into a semi-crystalline or crystalline state and was now exhibiting solid-like behavior.
It was also noted that the observed plateau regions and increases in G’ and G” were in direct agreement with the acquired Raman spectral data (Figure 4).
The normalized 808 cm-1 peak height was close to zero and remained unchanged by decreasing temperature in the melt region (~190 °C to 130 °C),1 but the normalized 808 cm-1 peak height increased considerably and in unison with the abrupt increases in both G’ and G” as the PP melt began to crystallize.
As the PP sample began to crystallize, a rapid decrease in the total peak area of the CH stretching region was observed before any measurable growth of the 808 cm-1 band. It is believed that the decrease in intensity in the 3050 cm-1 to 2,800 cm-1 spectral region was caused by the formation of crystallites in the PP matrix.
Crystallites with dimensions on the same order of magnitude as the incident laser’s wavelength (532 nm) would scatter light, creating a loss in the CH stretching bands’ Raman signal intensity.
It was also observed that the minimum in the CH stretching profile was directly aligned with both the observed crossover between G’ and G” and the maximum slope of the normalized 808 cm-1 peak profile.
This correlation between changes in Raman spectral features and rheological response shows that the crystallization rate was at its maximum at the same time as the crystallite concentration was greatest. The integrated area of the CH stretching region returned to a value close to the value detected in the melt phase after the observed decrease in intensity.
Isothermal crystallization studies were performed at 150 °C and 138 °C to further evaluate PP’s crystallization process.
PP samples were heated for a minimum of five minutes at 190 °C to fully melt the specimen before being rapidly cooled at 10 °C per minute until the samples were 10 °C above the crystallization temperature. Samples were then cooled at a slower rate of 2 °C per minute until they reached the set crystallization temperature.
Crystallization temperature was held constant for a maximum of one hour (3600 seconds) to allow the isothermal crystallization of PP to be observed as a function of time.
Rheology and Raman spectroscopy data was simultaneously acquired in situ during crystallization at 138 °C and 150 °C (Figures 5 and 6, respectively). The PP material was initially viscously dominated (G’ < G”) at both isothermal temperatures, displaying liquid-like behavior. A crossover in G’ and G” was observed as time progressed, with the moduli increasing two to three orders of magnitude.
The crossover at 138 °C was found to occur 84 seconds into the isothermal curing process, while the crossover at 150 °C took a total of 2150 seconds to be observed. G’ and G” reached a plateau following the observed crossover, at which the crystallization process was confirmed as stabilized and complete.
Like the previous experiments, the rheology and Raman data agreed during the isothermal crystallization studies (Figures 5 and 6). The increase in the elastic and viscous moduli directly correlates with the increase in the normalized 808 cm-1 peak height. As the specimen transitioned from the liquid to the solid state, a minimum in the CH stretching band intensity (not shown) was also observed.
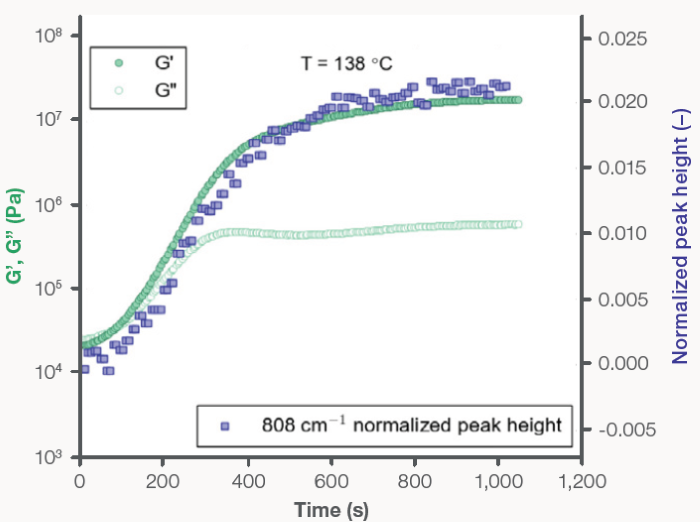
Figure 5. PP isothermal recrystallization at 138 ºC: (filled circles) G’ and (open circles) G”, plotted on the left y-axis, and (filled squares) the normalized 808 cm-1 Raman shift peak height, plotted on the right y-axis, as a function of time. Image Credit: Thermo Fisher Scientific – Materials Characterization
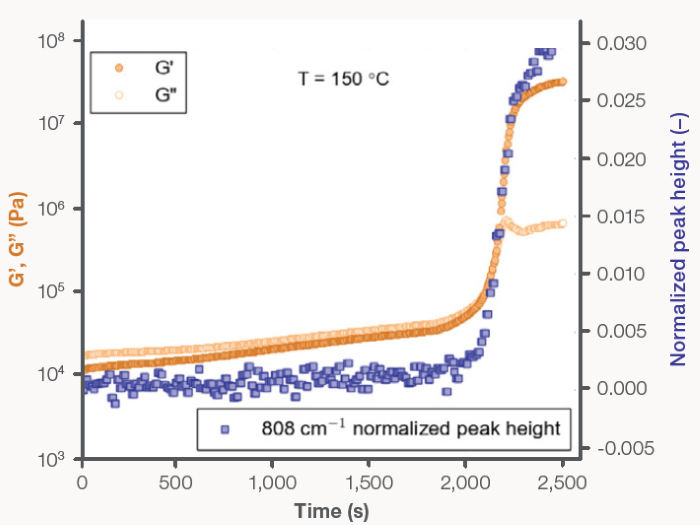
Figure 6. PP isothermal recrystallization at 150 °C: (filled circles) G’ and (open circles) G”, plotted on the left y-axis, and (filled squares) the normalized 808 cm-1 Raman shift peak height, plotted on the right y-axis, as a function of time. Image Credit: Thermo Fisher Scientific – Materials Characterization
Conclusions
The Rheo-Raman system was used to simultaneously monitor the rheological and Raman spectroscopic behavior of PP during its melt-to-crystallization transition. This multimodal analytical approach enabled a direct correlation between bulk structural properties (G’ and G”) and real-time molecular-level conformational changes, specifically, helical chain vibrations and CH stretching.
The data showed that the crystallization rate peaked - evidenced by sharp increases in G’, G”, and the normalized 808 cm-1 peak height - when crystallite concentration was highest, which was indicated by a drop in overall Raman spectral intensity within the 3050–2800 cm-1 region.
This clear connection between macroscopic and molecular-level behavior highlights the unique analytical power of combining rheology with Raman spectroscopy. While this study centers on the melting and crystallization of PP, the demonstrated approach has broader relevance and could be applied to other material processes such as gelation, polymerization, curing, and various shear-induced phenomena.
References and Further Reading
- Kotula, A.P., et al. (2016). The rheo-Raman microscope: Simultaneous chemical, conformational, mechanical, and microstructural measures of soft materials. 87(10), pp.105105–105105. https://doi.org/10.1063/1.4963746.
- Khafagy, R.M. and Badr, Y.A. (2005). In situ FTIR spectroscopic study of the recently detected low-temperature-induced structural changes in isotactic polypropylene. Journal of Polymer Science Part B: Polymer Physics, 43(20), pp.2829–2842. https://doi.org/10.1002/polb.20567.
Acknowledgments
Produced from materials originally authored by Nathan C. Crawford and David Drapcho from Thermo Scientific.

This information has been sourced, reviewed and adapted from materials provided by Thermo Fisher Scientific – Materials Characterization.
For more information on this source, please visit Thermo Fisher Scientific – Materials Characterization.