Sponsored by HORIBAReviewed by Olivia FrostJan 15 2026
The measurement of samples in the transmission configuration presents opportunities that conventional backscattering coupling with a microscope cannot address.
Although not a recent innovation, Transmission Raman Spectroscopy (TRS) has seen a resurgence in interest due to the potential integration of high-power near-infrared (NIR) lasers and specialized accessories that facilitate sample analysis in this geometry.
TRS necessitates the use of diffusing materials, such as tablets, and was initially developed for pharmaceutical applications. It is also effective for capsules and other diffusing and translucent materials beyond the pharmaceutical sector, enabling comprehensive sample analysis.
Applications can be found across various domains, including biomaterials (such as tissues and food) and polymers, allowing for successful measurement of samples through packaging.
Transmission Raman Spectroscopy
Raman spectroscopy has experienced significant advancements in hardware over the past few decades. It is now commonplace to interface a microscope with a Raman spectrometer to analyze objects down to the sub-micron level.
However, in certain instances, the information derived from microscope coupling is overly restrictive, concentrating on a diminutive volume of the sample near the surface and potentially yielding incomplete insights in cases of sample heterogeneity.
TRS offers a compelling alternative when bulk measurements of heterogeneous samples are necessary. By collecting the signal opposite the laser illumination, the Raman spectrum obtained from the transmitted light encapsulates the entirety of the sample, thereby addressing the sub-sampling issue (as shown in Figure 1).
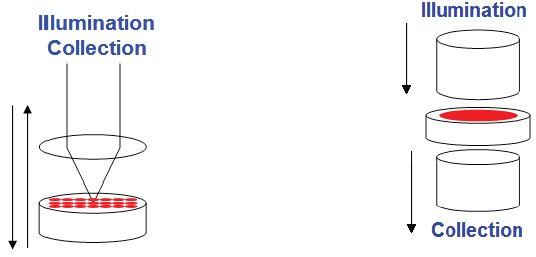
Fig 1. Geometry of the transmission measurement (right) as opposed to the backscattering mode (left). Image Credit: HORIBA
In contrast, backscattered measurements, particularly when paired with a microscope, may provide only partial information. For instance, pharmaceutical tablets are frequently coated, and backscattering measurements predominantly reflect the coating.
Figure 2 illustrates the transmission and backscattered Raman spectra of an anti-inflammatory Advil tablet: the blue spectrum primarily indicates the presence of TiO2 (anatase form, evidenced by the peak at 145 cm-1) and sugar, which constitute the coating.
Conversely, the transmission spectrum is more intricate; in addition to the Raman peaks from anatase originating from the coating, peaks from other compounds located in the core, such as the active pharmaceutical ingredient (ibuprofen), are observed.
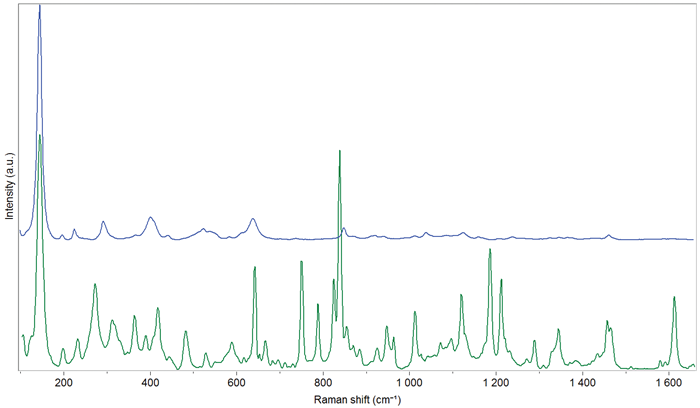
Figure 2. Backscattered (blue) and transmission (green) Raman spectra of an anti-inflammatory (Advil) tablet. Image Credit: HORIBA
TRS for Pharmaceutical Applications
Quantitative Evaluation and Calibration Method
Monitoring the active pharmaceutical ingredient (API) within formulations is crucial for ensuring correct dosage. Since Transmission Raman spectra of tablets or capsules accurately represent the entire sample and are less sensitive to local variations, quantitative determinations of the various constituents are feasible.
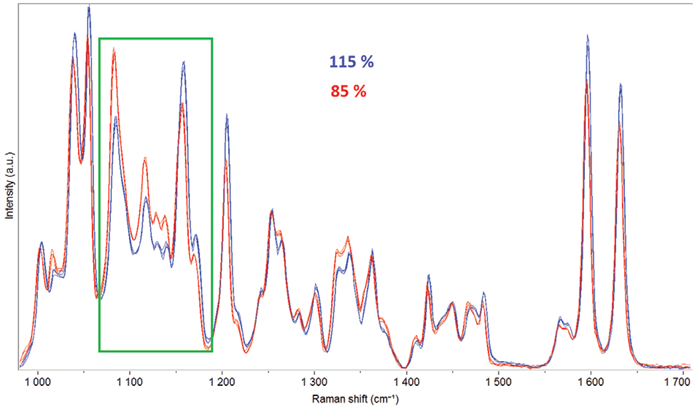
Fig. 3. Transmission spectra of tablets with two different amounts of API (85 and 115 % of the target value). Image Credit: HORIBA
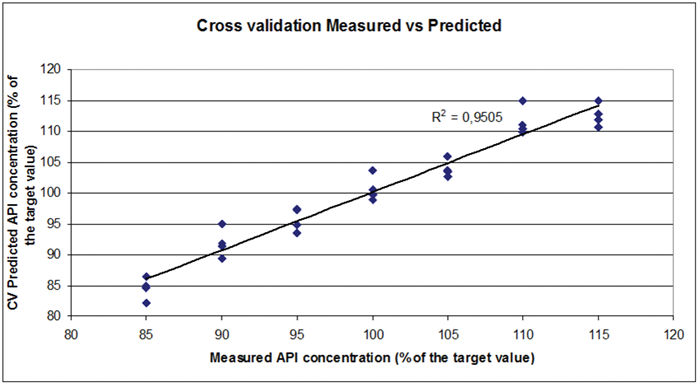
Fig. 4. Cross validation results obtained after the PLS calibration of a set of tablets formulated with various amounts of API around the target value. Image Credit: HORIBA
By measuring a set of calibrated reference samples in transmission and applying appropriate chemometric algorithms, such as Partial Least Squares (PLS), a calibration method can be developed for unknown test samples to provide quantification data.
Figure 3 illustrates the spectral differences observed in transmission spectra, with API amounts varying between 85 % and 115 % around the target value (equivalent to 21.2 % and 28.7 % of the total weight).
Figure 4 presents the cross-validation results associated with the calibration of the tablet set, demonstrating the method's capability to yield acceptable quantitative results.
Polymorphism
Many active ingredients exist in multiple polymorphic forms, with only one of these being the desired form for drug formulation. Therefore, it is essential to control which form is present within the mixture.
Raman spectroscopy, being non-invasive and highly selective for discriminating between polymorphs, is well-suited for identifying the forms present in tablets or capsules.
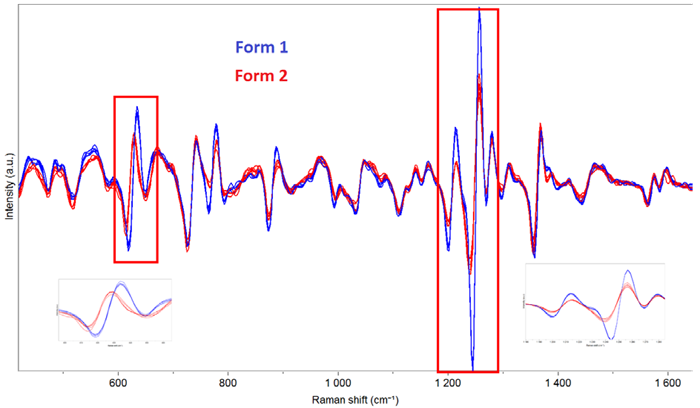
Fig. 5. Derivative spectra of capsules containing Form 1 and Form 2 of the Active ingredient. Image Credit: HORIBA
Clear differences can be observed, demonstrating the capability to discriminate between polymorphs in formulations. It is even possible to quantify the proportion of each form, allowing for the detection of the undesired form at low levels (estimated at 2 % of form 2 in form 1 in this example).
Analysis of Fat Composition in Food Without Sample Preparation
The fatty acid composition of foods influences various aspects of food quality. For instance, the consumption of trans fats increases the risk of health problems and is therefore regulated in many countries.
Variations in fatty acid composition have been established between the different fat layers (outer and inner) of adipose tissues. In this context, obtaining an averaged spectrum of a bulk sample is necessary when global information is required.
TRS provides such averaged information. Adipose tissues from lamb, veal, and pork chops were measured, with samples of varying sizes and thicknesses analyzed without any preparation using TRS.
Raman spectra offer multiple insights into the sample composition. For example, trans fatty acids are easily identifiable from the spectra, with the peak at 1668 cm-1 directly linked to the trans configuration of the C=C double bond in fatty acids.
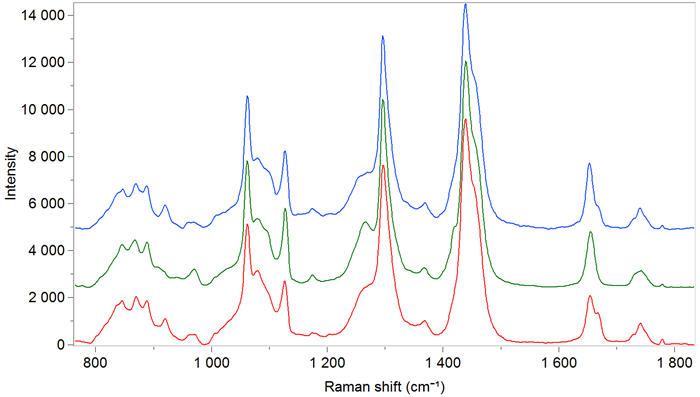
Figure 6. Transmission Raman spectra of adipose tissues from different species (lamb, pork, veal) using the transmission accessory operating at 785 nm. Image Credit: HORIBA
Similarly, Raman spectra can be utilized to derive quantitative information about fatty acid profiles. Classification of species based on the Raman signature of their adipose tissues is also feasible, as illustrated by the score plot in Figure 7.
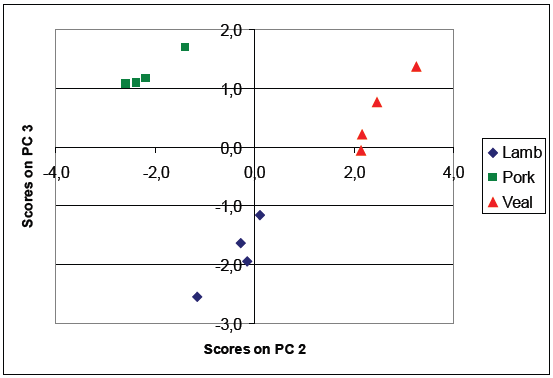
Figure 7. Principal component analysis score plot of samples of lamb, pork, and veal adipose tissues. Image Credit: HORIBA
New Applications for TRS
Polymers
While particularly well-suited for pharmaceutical applications, TRS can also be effectively applied to various sample types, including polymers.
Figure 8 displays the transmission Raman spectra of polymer materials, including a two-layer polyethylene–polypropylene sample, showcasing the spectral features of both materials.
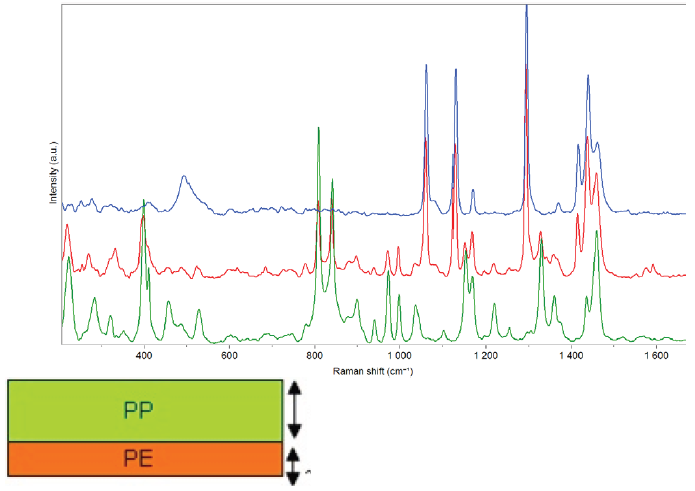
Fig.8. Transmission spectra of polymer materials: polyethylene, polypropylene, and a bi-layer sample made of a 1.5 mm polypropylene layer and a 0.75 mm polyethylene one. Image Credit: HORIBA
This technique can thus be employed for the quality control of polymer samples, which may include a quantification step for the different layers and/or components.
Measurement Through Packages
As demonstrated in previous examples, transmission is the preferred geometry for analysis when bulk measurements are required. It may also be utilized when the contents of a packaged material need to be analyzed without removal from the packaging.
Figure 9 shows the spectrum of a shower gel measured through its PET package. In this instance, the contribution of the PET is minimal, rendering this measurement technique suitable for quality control of the gel.
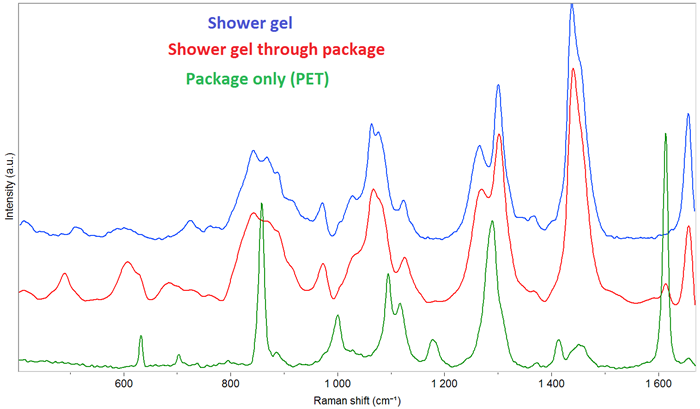
Fig.9. Transmission spectra of a shower gel: only the gel, the gel through the package and the PET package. Image Credit: HORIBA
The stability of products in their original packaging over time can be evaluated using this technique without the need to transfer a subsample into any vial, thus avoiding the risk of transferring a non-representative fraction of the products or introducing contamination.
Conclusions
The transmission design has proven to be the technique of choice whenever Raman spectral information of a bulk material is required. It has already demonstrated its utility for pharmaceutical applications, as tablets and powder mixtures are well-suited for this measurement mode.
Furthermore, TRS may be successfully applied to other sample types, such as polymers, bio-tissues, or any translucent material, and can be considered for evaluating the contents of products inside packaging.
Additionally, as TRS offers comprehensive spectral information of the measured sample, it will be the preferred technique for quantitative evaluation of mixtures.
Acknowledgements
Produced from material originally authored by Vincent Larat from HORIBA.
References and Further Reading
- Piloto, A.M., et al. (2011). Photolysis at long wavelengths of amino acid ester derivatives based on 4-methyl-6-methoxy-2-oxo-2H-naphtho[1,2-b]pyrans. Uminho.pt. (online) https://doi.org/10.1002/ejoc.201100391.
- Buckley, K. and Matousek, P. (2011). Recent advances in the application of transmission Raman spectroscopy to pharmaceutical analysis. Journal of Pharmaceutical and Biomedical Analysis, 55(4), pp.645–652. https://doi.org/10.1016/j.jpba.2010.10.029.
- Johansson, J., et al. (2007). Quantitative Transmission Raman Spectroscopy of Pharmaceutical Tablets and Capsules. Applied Spectroscopy, 61(11), pp.1211–1218. https://doi.org/10.1366/000370207782597085.
- Najbjerg, H., et al. (2011). Monitoring cellular responses upon fatty acid exposure by Fourier transform infrared spectroscopy and Raman spectroscopy. The Analyst, 136(8), pp.1649–1649. https://doi.org/10.1039/c0an00916d.
- Beattie, J.R., et al. (2006). Prediction of adipose tissue composition using raman spectroscopy: Average properties and individual fatty acids. Lipids, 41(3), pp.287–294. https://doi.org/10.1007/s11745-006-5099-1.
- Nils Kristian Afseth, Segtnan, V.H., Marquardt, B.J. and Jens Petter Wold (2005). Raman and Near-Infrared Spectroscopy for Quantification of Fat Composition in a Complex Food Model System. Applied Spectroscopy, 59(11), pp.1324–1332. https://doi.org/10.1366/000370205774783304.
- Johansson, J., et al. (2006). Time-Resolved NIR Spectroscopy for Analysis of Solid Pharmaceuticals. NIR news, 17(4), pp.7–9. https://doi.org/10.1255/nirn.896.

This information has been sourced, reviewed and adapted from materials provided by HORIBA.
For more information on this source, please visit HORIBA.