Sponsored by HORIBAReviewed by Olivia FrostAug 14 2025
This article outlines the role of Raman spectroscopy in supporting cathode and anode analysis in lithium-ion batteries.
Introduction
Lithium-ion batteries (LIB) have been of significant interest for many years, offering a rechargeable alternative to lithium batteries. These batteries are widely employed in various portable electronic devices, cordless tools, and in newly developed electric vehicles.
As these devices' power demands and complexity continue to grow, lithium-ion battery performance has become a critical concern, influenced by the condition of both the cathode and the anode.
During the charge/discharge cycle, the lithium ions travel from one electrode to the other (through the electrolyte), inducing structural changes in both materials. Ideally, all observed changes are reversible; however, in some cases, the charging/discharging cycle can induce irreversible changes in either the cathode or anode.
Raman spectroscopy provides a direct solution to structural changes in analyzed materials. As a rapid, non-contact method, it does not affect the samples, and in the context of batteries, it allows instantaneous evaluation during the charge/discharge cycle. With its ease of use and information-rich output, Raman spectroscopy is an exceptional instrument across multiple analysis levels, ranging from diverse R&D needs to automatic quality control measurements.
Cathode Analysis
The most commonly utilized material for a cathode is layered lithium cobalt oxide LiCoO2 (LCO). During the charge/discharge cycle, lithium ions are de-intercalated or intercalated into the layered cobalt-oxygen octahedral structure.
Over-discharging is known to decompose this oxide, typically irreversibly, into lithium oxide (Li2O) and cobalt oxide (CoO), while over-charging converts LiCoO2 into cobalt dioxide (CoO2). Raman spectroscopy can be used to observe all these transformations (Figure 1). The Raman map recorded on the cathode after the charge/discharge cycle clearly shows the presence of cobalt dioxide (Figure 2).
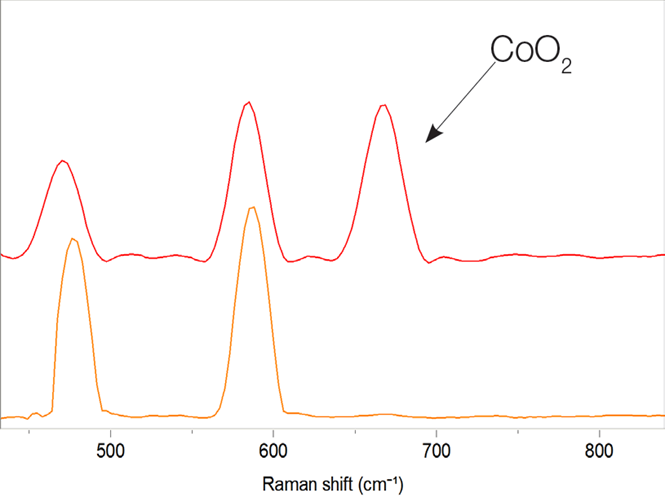
Figure 1. Spectral difference between LiCoO2, and LiCoO2 with a presence of cobal oxide CoO2. Image Credit: HORIBA
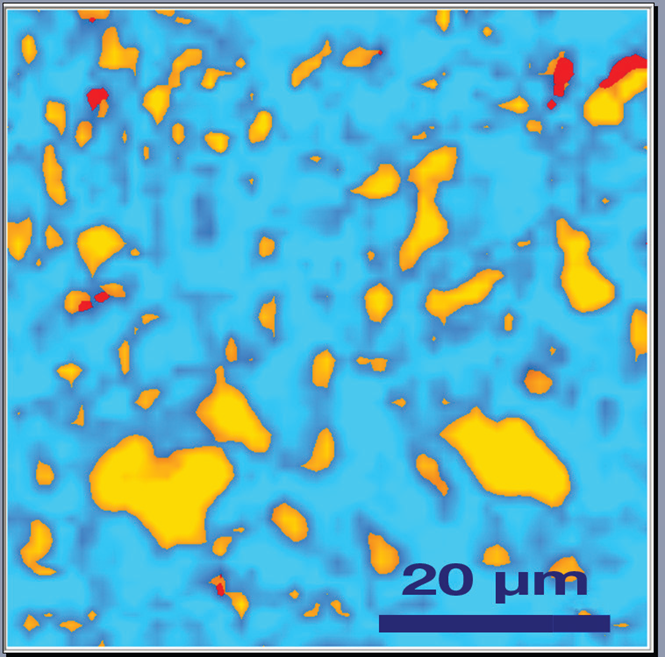
Figure 2. Raman image LiCoO2 cathode after a cycling process, the presence of CoO2 was detected: blue colour corresponds to the presence of amorphous carbon, orange spots shows the distribution of LiCoO2, and red spots corresponds to different concentrations of CoO2. Image Credit: HORIBA
New materials are being studied as potential cathode material alternatives; these typically include various types of lithium-transition metal(s) mixed oxides Li(Ni,Mn,Co)O2, LiMn2O4, Li2TioO3 compared to LiCoO2. Raman spectroscopy can provide additional insight into the potential structural and chemical transformations of these materials (Figure 3).
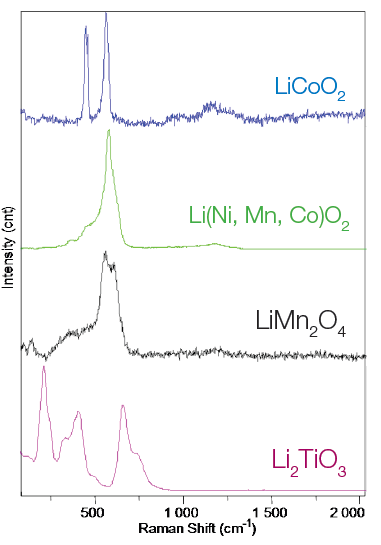
Figure 3. Raman spectra of cathode materials: LiCoO2, Li(Ni,Mn,Co)O2, LiMn2O4 and Li2TiO3. Image Credit: HORIBA
Anode Analysis
Graphite is the most commonly used anode material. Like cathode layered materials, graphite can deteriorate after the charging/discharging cycle. The ID/IG ratio of the D and G bands in the Raman spectrum is related to structural damage. The increasing intensity of the D band with respect to the intensity of the G band, reflects graphite degradation. Raman imaging clearly shows the structural changes in graphite (Figure 4).
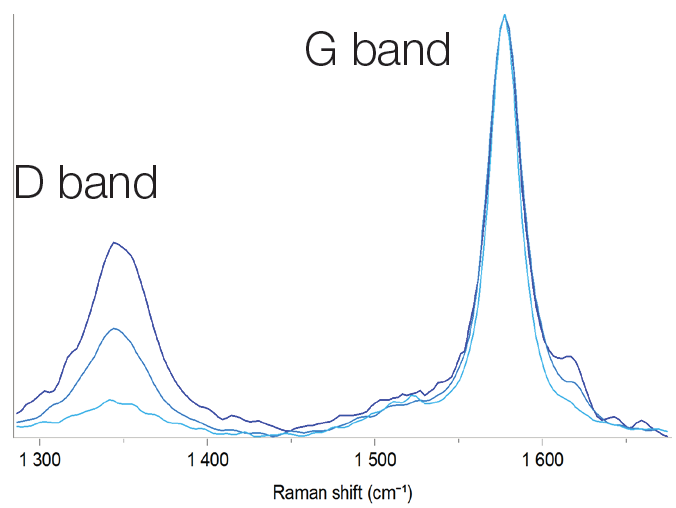
Figure 4. Raman spectra of graphite with different ID/IG ratio. Image Credit: HORIBA
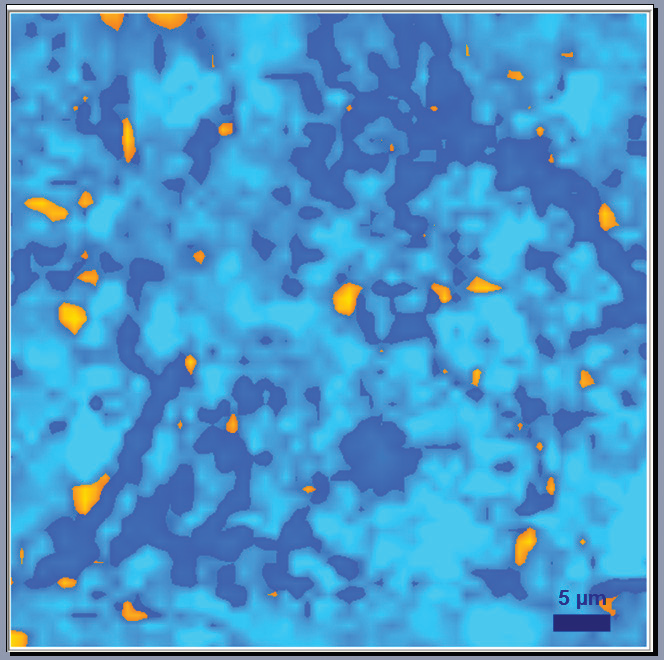
Figure 5. Raman image graphite anode after a cycling process: blue zones show graphite with a relatively low level of defects; and dark blue show graphite with higher level of defects; and orange zones correspond to presence of a binder (resin). Image Credit: HORIBA
Conclusions and Perspectives
Today’s advanced technologies require energy sources that are increasingly reliable, efficient, and powerful, making lithium-ion batteries of significant interest. Raman spectroscopy accommodates various stages of the lithium-ion battery life cycle by enabling the characterization of new materials for more versatile systems. It also facilitates failure analysis, more standard analysis of materials used throughout charge/discharge cycles—including their structural and electronic properties—and robust, automated quality control testing.
Acknowledgments
Produced from materials originally authored by Renata Lewandowska, Miyoko Okada, and Tomoko Numata at HORIBA Scientific.
References and Further Reading:
- R. Baddour‐Hadjean and J.P. Pereira-Ramos (2009). Raman Microspectrometry Applied to the Study of Electrode Materials for Lithium Batteries. Chemical Reviews, 110(3), pp.1278–1319. https://doi.org/10.1021/cr800344k.
- Sethuraman, V.A., et al. (2010). Surface structural disordering in graphite upon lithium intercalation/deintercalation. Journal of Power Sources, 195(11), pp.3655–3660. https://doi.org/10.1016/j.jpowsour.2009.12.034.
- R. Kostecki, J. et al. (2025). Radware Bot Manager Captcha. (online) Available at: https://iopscience.iop.org/article/10.1149/1.2170551/meta (Accessed 7 Aug. 2025).
- Kostecki, R., et al. (2001). Failure modes in high-power lithium-ion batteries for use inhybrid electric vehicles. OSTI OAI (U.S. Department of Energy Office of Scientific and Technical Information). https://doi.org/10.2172/861953.
- Paul Scherrer Institute, https://www.psi.ch/en/lec
- Berkley Energy Storage & Conversion for Transportation and Re-newables Program, https://www.lbl.gov/research/energy-storage/

This information has been sourced, reviewed and adapted from materials provided by HORIBA.
For more information on this source, please visit HORIBA.