Sponsored by HORIBAReviewed by Olivia FrostAug 15 2025
Carbon material characterization is essential across multiple industries, especially for ensuring the quality of lithium-ion batteries (LiBs). This article examines the context and limitations of conventional evaluation techniques, and introduces HORIBA’s advanced solutions, including ParticleFinder™ for investigating carbon particles morphology and QCarbon for evaluating the D/G intensity ratio using Raman mapping.
The capabilities of this integrated methodology are demonstrated through the characterization of an unknown sample of carbon powder, highlighting the role of HORIBA’s novel technology in enabling accurate and efficient characterization of the sample.
Introduction
Carbon materials such as graphene, carbon black (CB), and carbon nanotubes (CNTs) serve critical roles in a wide range of applications, owing to their excellent properties, including high electrical conductivity, mechanical strength, and thermal stability. These characteristics make them indispensable in areas such as electronics, energy storage, composite materials, and nanotechnology.1
Due to the structural diversity and the presence of various defects and functional groups in carbon materials, accurate characterization is essential for optimizing their performance for high energy or power density.
Raman spectroscopy has established itself as a highly effective instrument for carbon material analysis. This non-destructive method delivers comprehensive insights into the structural and electronic attributes of carbon-based materials. Raman spectroscopy is capable of detecting defects, disorder, and crystallinity levels. It can differentiate between various carbon forms, including graphite, amorphous carbon, and multiple types of graphene and CNTs.2
In the context of lithium-ion batteries, Raman spectroscopy is a vital tool for investigating electrode materials, offering information regarding state of charge, structural changes during cycling, and degradation mechanisms. By evaluating Raman spectra, scientists can track the quality and consistency of carbon materials, ensuring compliance with the rigorous standards for high-performance energy storage systems.
However, the complexity and variability of carbon materials pose major obstacles to fulfilling modern industry requirements, particularly for lithium-ion batteries (LiBs). Advanced analytical approaches, such as transitioning from 2-peak to 4-5 peak fitting, are essential for capturing detailed properties of emerging carbon materials.
Particle size distribution and morphology critically affect electrode performance. However, conventional techniques frequently fall short in characterizing these properties accurately, resulting in inconsistent quality.
Existing quality control processes are labor-intensive and lack efficiency, diminishing both productivity and reliability. Ensuring accurate measurement remains challenging due to the heterogeneity of carbon materials, necessitating accurate baseline correction, signal-to-noise ratio management, and reliable peak fitting, all of which require specialized expertise.
HORIBA Solution
HORIBA addresses these obstacles through advanced Raman microscopy solutions, enabling accurate and efficient evaluation of carbon materials. Two essential tools within HORIBA’s portfolio are ParticleFinder™ and QCarbon, each delivering unique abilities for enhancing carbon material characterization.
ParticleFinder™ facilitates the study of carbon particle morphology by offering essential information regarding particle size and shape. QCarbon focuses on analyzing the D/G intensity ratio through Raman mapping, providing detailed insights into the structural characteristics of carbon materials.
ParticleFinder™ + XD‑100 Particle Disperser
HORIBA provides a comprehensive solution for carbon particles analysis, featuring both the ParticleFinder™ and the XD-100 Particle Disperser.
The ParticleFinder™ is a sophisticated tool designed for automated location, characterization, and Raman analysis of particles. It streamlines the workflow by rapidly locating hundreds or thousands of particles within a video image, analyzing shape and size descriptors, and performing chemical characterization via Raman spectroscopy. Its features include automated detection, size and shape analysis, and chemical characterization, all integrated into a streamlined workflow with the LabSpec 6 software.
The XD-100 Particle Disperser complements this system by ensuring accurate and efficient sample preparation through uniform dispersion of carbon materials without damaging the particles, thereby enhancing the precision of subsequent analyses.
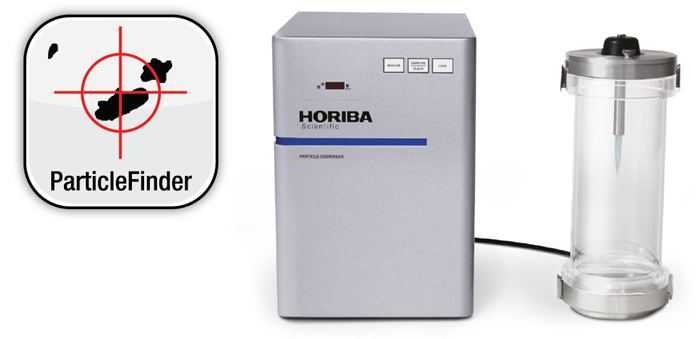
Figure 1. Picture of the XD‑100 Particle Disperser. Image Credit: HORIBA
This combined solution was employed to characterize the particles of the unknown powder. The powder was dispersed onto a glass microscope slide and analyzed using ParticleFinder in conjunction with the XploRA PLUS Raman microscope. The software automatically locates particles directly from the optical image, as illustrated in the picture below. A Raman acquisition is then conducted on each particle to determine its chemical nature.
The full measurement was completed in only 30 minutes, demonstrating the high throughput of this solution and its ability to quickly process large volumes of data.
The software identified three types of carbon as illustrated in the graph below. Spectrum A, featuring intense peaks at 1350 cm-1 and 1580 cm-1, corresponds to graphite or graphene, characterized by its highly ordered structure.
Spectrum B, exhibiting a pronounced peak near 1600 cm-1, signifies graphene oxide, which possesses a more disordered structure compared to pure graphene, due to the higher D/G ratio. Spectrum C, with a D/G ratio of 0.9, likely represents an intermediate state of carbon between graphite and graphene oxide—possibly a partially oxidized or reduced form of graphene.
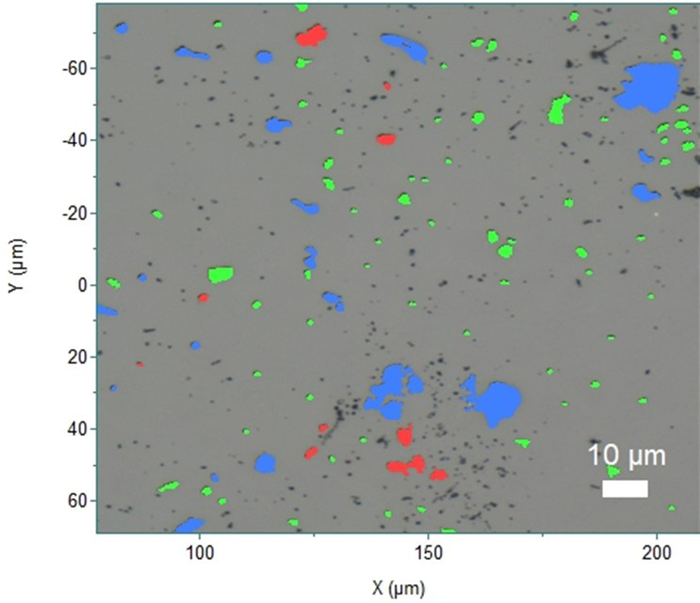
Figure 2. Optical image of the glass slide where ParticleFinder detected the particles and colored them with the color of the associated spectrum. Image Credit: HORIBA
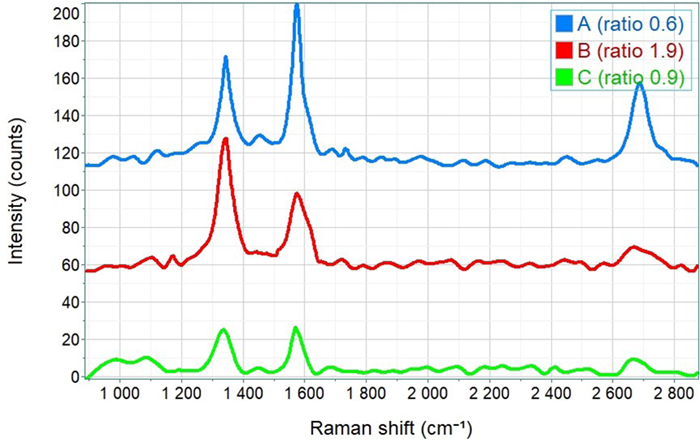
Figure 3. Raman spectra of the three main components of the carbon powder. Image Credit: HORIBA
The software also delivers in-depth morphological analysis, including statistical summaries and histograms for parameters such as area, perimeter, and circularity. The graph below represents the histogram of diameters for the three types of carbon. Results show that type C (intermediate state carbon) primarily consists of smaller particles (<5 μm), type B (graphene oxide) displays a moderate distribution across the size ranges, and type A (graphite/graphene) exhibits a wider range of particle sizes, including larger particles (>10 μm).
This distribution indicates that greater structural order corresponds to larger particle sizes, whereas increased disorder or oxidation results in smaller particle sizes.
Using HORIBA’s ParticleFinder™, chemical and morphological characterization of the unknown powder was completed, identifying three types of carbon: graphite/graphene, graphene oxide, and an intermediate state. Detailed statistics were also obtained regarding the morphology of these particles, such as diameter distribution, linking higher structural order with larger particle sizes and increased disorder or oxidation with smaller sizes.
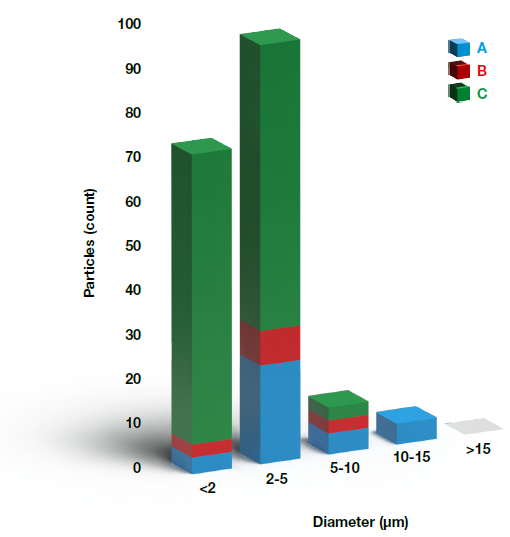
Figure 4. Histogram of diameters of the carbon particles; the colors in the histogram correspond to the colors of the reference spectra. Image Credit: HORIBA
QCarbon
. Image Credit: HORIBA
QCarbon is designed to optimize carbon material analysis using sophisticated Raman spectroscopy methods. This tool focuses specifically on the analysis of the D/G intensity ratio on Raman mapping, offering detailed insights into the structural attributes of various carbon materials.
Enhanced Analysis Methods
A curve-fitting approach that is universally applicable to a broad range of carbon types is essential to enable quantitative analysis of Raman spectra for carbon materials.3
QCarbon introduces a sophisticated 5-peak fitting method for more precise characterization of carbon materials. This approach uses a combination of Gaussian and Lorentzian fits to accommodate different peak shapes, important for analyzing complex carbon structures.4
The five key peaks include:
- G band (~1580 cm-1): Representing the ideal graphite lattice.
- D1 band (~1350 cm-1): Indicating disorder in the graphite lattice.
- D2 band (~1620 cm-1 ): Weakly present, representing additional disorder.
- D3 band (~1500 cm-1): Associated with amorphous carbon.
- D4 band (~1200 cm-1): Further indicating graphite lattice disorder.
Automated Reporting
QCarbon simplifies the full analysis process with its one-click report generation feature. The automated workflow includes:
- Data Acquisition and Processing: Automated procedures for range cutting, de-spiking, smoothing, and baseline correction to ensure high-quality data.
- Peak Analysis: The system identifies and fits peaks, determining their amplitudes, areas, and widths, along with generating statistical data such as mean values and standard deviations.
- Report Generation: Processed data is compiled into customizable reports, offering a detailed overview of analysis findings. This automation substantially shortens the time needed for QC processes, accelerating decision-making and boosting operational efficiency.
Methods and Correctness
To ensure precision and dependability, QCarbon utilizes stringent preprocessing techniques such as de-spiking and baseline correction. Fitting parameters are meticulously tuned to correspond with the specific properties of various carbon materials, guaranteeing accurate and meaningful outcomes.
Special Cases and Custom Solutions
QCarbon is also equipped to handle special cases, including the analysis of single-wall carbon nanotubes (SWCNTs). These materials present unique challenges, such as low D peak intensity and baseline discrepancies. QCarbon delivers customized solutions and multiple processing tailored to user needs based on fitting principles, enabling precise and reproducible results.
To closely analyze the D/G ratio of the unknown powder, the powder was spread on a glass slide, and a 50 μm x 50 μm area was mapped with 1 μm steps. Raman mapping was performed using the high-performance XploRA™ PLUS microRaman tool. Raw mapping data was transferred directly to the QCarbon application, where it was automatically processed and evaluated within seconds.
The software generates three Raman images, presented in the graph below. The first two illustrate the intensity, width, or area of the D band and G band respectively. The third image displays the ratio of the intensity, width, or area of D to G. These maps indicate that the carbon powder sample is heterogeneous, with a mixed distribution of ordered and disordered regions.
The degree of disorder varies across the sample, with some regions displaying elevated defect density and others exhibiting more ordered carbon structures. This points to a non-uniformity within the structural characteristics of the carbon material.
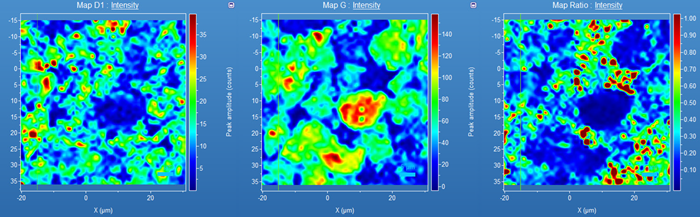
Figure 5. Raman maps of the carbon powder. Map D1 shows the intensity of the D band, Map G shows the intensity of G band, and Map Ratio shows the ratio of D band intensity over G band intensity. Image Credit: HORIBA
Statistics about the distribution of intensity, width or ratio of D band, G band, or the D/G ratio was also obtained. Since the focus is on the intensity ratio, the corresponding histogram, illustrated in the figure below was studied. It is revealed that 80% of the D/G ratios fall between 0 and 0.5 (30% < 0.2 and 50% between 0.2 and 0.5), signifying that the majority of the mapped region exhibits a relatively low disorder level.
Conversely, 20% of D/G ratios exceed 0.5, signifying that a smaller portion has a higher degree of disorder. This analysis indicates that the powder is predominantly graphitic with a low level of disorder.
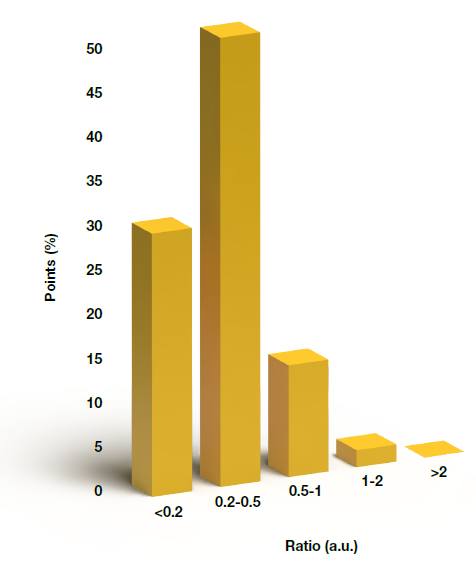
Figure 6. Histogram of D/G intensity ratio. Image Credit: HORIBA
In-depth insights into the structural characteristics of the carbon powder sample were obtained through QCarbon analysis, demonstrating the instrument’s accuracy and efficiency. By employing advanced Raman spectroscopy in combination with a sophisticated 5-peak fitting approach, it was possible to precisely differentiate between ordered and disordered regions within the sample.
This study validates that the carbon powder is mainly graphitic with minimal disorder, highlighting QCarbon’s capability to provide thorough and precise characterization. This makes it an essential tool for sectors that depend on high-quality carbon materials.
Conclusion
Carbon material analysis holds critical importance across numerous sectors due to the distinct characteristics and performance capabilities of these materials. Ensuring accurate and efficient analysis is essential to uphold high-quality standards and support technological development. Together, HORIBA’s ParticleFinder™ and QCarbon provide a complete and rapid solution for in-depth characterization of carbon materials.
The ParticleFinder™ application, used in conjunction with the XD-100 Particle Disperser, delivers a high-throughput approach to carbon particle analysis. It automates particle location, characterization, and Raman analysis, efficiently processing large volumes of data.
QCarbon’s advanced 5-peak fitting approach, automated reporting capabilities, and compliance with industry protocols ensure precise and reliable analysis. By streamlining the QC process and reducing manual involvement, QCarbon substantially improves productivity and decision-making speed.
With these tools, HORIBA delivers a full turnkey solution, addressing the complex requirements of contemporary industries and supporting continuous developments in material science and quality control. HORIBA continues to set new benchmarks in the domain, offering robust and intuitive solutions that foster progress and innovation in carbon material evaluation.
Acknowledgments
Produced from materials originally authored by H. Elazri , C. Eypert , Z. Pengyu at HORIBA FRANCE SAS, Palaiseau, France and HORIBA Trading Co.,Ltd., Beijing, China.
References and Further Reading:
- Holmes, M. (2014). Global carbon fibre market remains on upward trend. Reinforced Plastics, 58(6), pp.38–45. https://doi.org/10.1016/s0034-3617(14)70251-6.
- Bokobza, L., Bruneel, J.-L. and Couzi, M. (2015). Raman Spectra of Carbon-Based Materials (from Graphite to Carbon Black) and of Some Silicone Composites. C, 1(1), pp.77–94. https://doi.org/10.3390/c1010077.
- Okuda, H., et al. (2018). Investigating nanostructures in carbon fibres using Raman spectroscopy. Carbon, 130, pp.178–184. https://doi.org/10.1016/j.carbon.2017.12.108.
- Sadezky, A., et al. (2005). Raman microspectroscopy of soot and related carbonaceous materials: Spectral analysis and structural information. Carbon, 43(8), pp.1731–1742. https://doi.org/10.1016/j.carbon.2005.02.018.

This information has been sourced, reviewed and adapted from materials provided by HORIBA.
For more information on this source, please visit HORIBA.