The flow behavior of polymers used in the plastics industry is often measured via the melt flow rate (MFR). This metric is one of the simplest and most commonly used test methods for determining plastic flow behavior; however, it isn’t always good enough for determining the melt properties of a substance.
This article discusses a practical case comparing the analysis of two LDPE (low-density polyethylene) samples with the same MFR value, but exhibiting different behavior during processing.
Different suppliers produced both LDPE samples, though both samples had an MFR of 4.0 g per 10 minutes. This difference was significant, as one of the LDPEs caused substantial problems during production.
Materials and Methods
Test Arrangements
- Torque-Rheometer System: HAAKE™ PolyLab™ OS Torque Rheometer (Thermo Scientific™)
- Torque-Rheometer drive unit: HAAKE RheoDrive 7 OS Drive Unit from (Thermo Scientific)
- Analysis software: HAAKE PolySoft OS Capillary Software (Thermo Scientific)
- Laboratory single screw extruder: Rheomex 19/25 OS
- Extruder screw: L = 25 x D, compression ratio 2:1
- Melt pump fitted with bypass valve
- Melt-pressure sensors
- Slit capillary die: 0.8 x 2.0 mm
Test Conditions
- Liquid-cooled extruder feeding zone
- Profile extruder temperature: 180 °C, 240 °C, and 280 °C
- Melt pump temperature: 280 °C
- Temperature at die: 280 °C
- Extruder speed: 100 rpm
- Melt pump speed: five to 60 rpm (programmed)
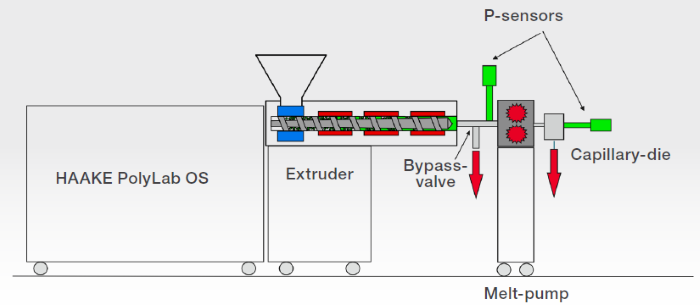
Figure 1. Measurement with melt-pump. Image Credit: Thermo Fisher Scientific – Materials Characterization
Test Procedure
Polymer pellets were melted and homogenized in the extruder before being transferred into the melt pump via a bypass valve (Figure 1).
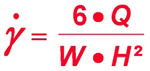
By adjusting the pump speed, a defined volume (Q) was driven through the slit-capillary die. This setup allows the apparent shear rate to be calculated directly from the capillary dimensions (W, H) and the measured volume flow (Q).
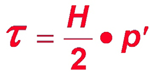
The pressure drop (p’) in the capillary is measured via pressure transducers, while the shear stress (τ) is calculated from the capillary geometry and the pressure drop.
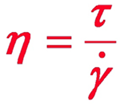
It is then possible to calculate apparent viscosity (η) from the apparent shear rate and the shear stress.
Gradually increasing the melt pump’s speed increases shear rates. The viscosity function of the polymer melt is obtained by measuring the pressure drop at each speed step.
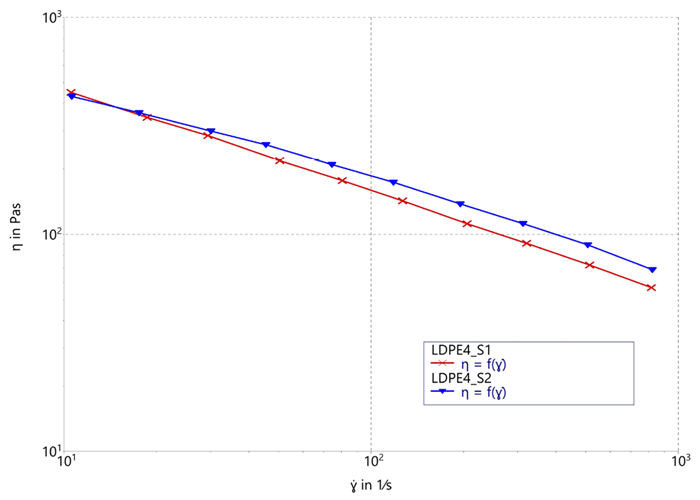
Figure 2. slit-capillary measurement with LOPE (Ml 4). Image Credit: Thermo Fisher Scientific – Materials Characterization
Results and Discussion
Figure 2 displays viscosity measurement results for the two LDPE samples in a single graph.
The samples show the same viscosity behavior at low shear rates, but shear rates varied considerably during processing. The graph shows distinct differences between the samples at higher shear rates.
Because the MFR method only measures one point in the viscosity behavior at low shear rates, this method alone could not show these differences.
Summary
As this test shows, the extruder capillary rheometer was able to differentiate the two samples. The MFR method failed to do so because it captures only a single viscosity point, offering insufficient insight at low shear rates.
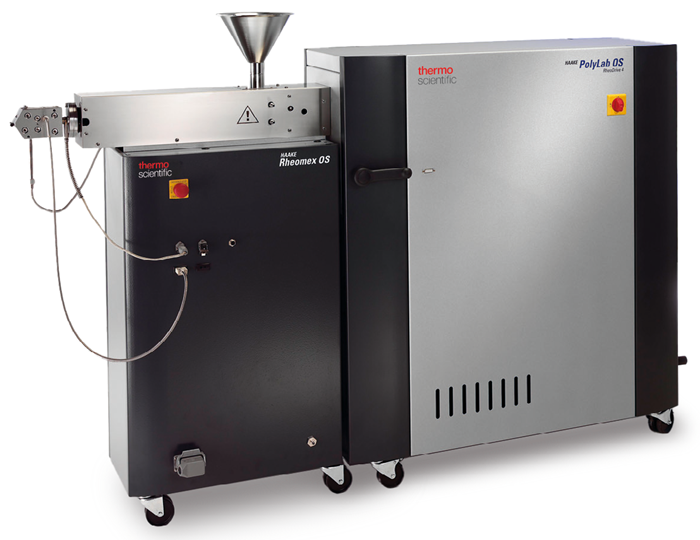
HAAKE PolyLab OS Torque Rheometer. Image Credit: Thermo Fisher Scientific – Materials Characterization
Acknowledgments
Produced from materials originally authored by Matthias Jährling from Thermo Scientific.

This information has been sourced, reviewed and adapted from materials provided by Thermo Fisher Scientific – Materials Characterization.
For more information on this source, please visit Thermo Fisher Scientific – Materials Characterization.