In this interview, industry expert Grant Cumming outlines PLQY fundamentals, comparing relative and absolute methods, key challenges like stray light and reabsorption, and future advances including certified standards, integrating spheres and AI-driven tools to improve accuracy and reliability.
To get started, could you give us an overview of what photoluminescence quantum yield (PLQY) is and why it's such a critical parameter when characterizing emissive materials?
PLQY is a measure of how efficiently a material converts absorbed light into emitted light. It’s the ratio of the number of photons emitted to the number of photons absorbed. A PLQY of 100 % means every photon absorbed is re-emitted as a photon of luminescence. A low PLQY indicates that other non-radiative processes are dominant.
PLQY is a critical figure of merit for any emissive material. It directly correlates with the brightness and efficiency of photoluminescent samples. High PLQY is essential for materials with a variety of applications such as display technologies, chemical sensors, or medical imaging.
What are the main differences between relative and absolute PLQY measurements, and when might one approach be more appropriate than the other?
Relative PLQY compares the sample’s emission intensity to that of a known standard with well-documented PLQY, such as rhodamine-6G or quinine bisulfate. In this method, the emission of the known standard and the sample are measured using identical parameters; then, based on their respective emission intensity and absorbance, the PLQY of the sample can be calculated.
The main advantage of relative PLQY experiments is that it can be performed using a basic spectrofluorometer instrument. This makes relative PLQY a very accessible method to measure quantum yield.
However, relative PLQY is highly susceptible to experimental error as the known standard and the sample must be measured under identical conditions. For instance, differences in solvent refractive index, temperature, or concentration between the unknown sample and the reference standard can introduce significant inaccuracies. It can also be difficult to find an appropriate reference standard to compare with your sample, as the excitation and emission regions must be shared by both. Ideally, the reference and sample would also have a similar PLQY to ensure that the same excitation and emission parameters provide good quality spectral data for both. Finally, perhaps the most significant weakness of the relative PLQY method is that it quickly becomes very complex when measuring solid samples due to the directional considerations needed to reliably determine their absorbance and emission.
In contrast, absolute PLQY directly calculates the number of photons absorbed and emitted by the sample, with no need for a reference standard to be used. By employing an integrating sphere, we can harvest the emission and scattered excitation in all directions simultaneously. This results in a much more versatile way to determine PLQY which can be used on opaque samples, bulk solids, films, and liquids alike.
In its simplest form the absolute PLQY method requires the recording of only two emission spectra: the sample and the blank. The number of photons emitted by the sample is then directly calculated and divided by the number absorbed to give the quantum yield.
While absolute PLQY experiments are simpler to perform than relative PLQY, they require careful, sample-dependent parameter selection and the use of a well-calibrated integrating sphere.
For those unfamiliar with the setup, could you describe the role of an integrating sphere in absolute PLQY measurements and how it helps eliminate geometric errors?
An integrating sphere is vital for absolute PLQY measurements as it allows for the complete collection of both emitted and scattered light from a sample, regardless of direction. This removes one of the most difficult aspects of the relative PLQY method, where you must account for directional bias in the photoluminescence emission. For example, the PLQY of samples such as thin films is extremely difficult to measure by the relative method. Their waveguiding properties often lead to significant over- or under-estimation of the true PLQY depending on the placement of the detector.
Integrating spheres are lined with a highly Lambertian reflective material, such as sintered PTFE, which diffusely reflects photons within the sphere. Coupled with a baffle placed between the sample and the emission port, these diffuse reflections homogenize the light distribution inside the sphere, effectively removing any directional components of the sample emission. This uniformity is what enables accurate, geometry-independent PLQY measurements.
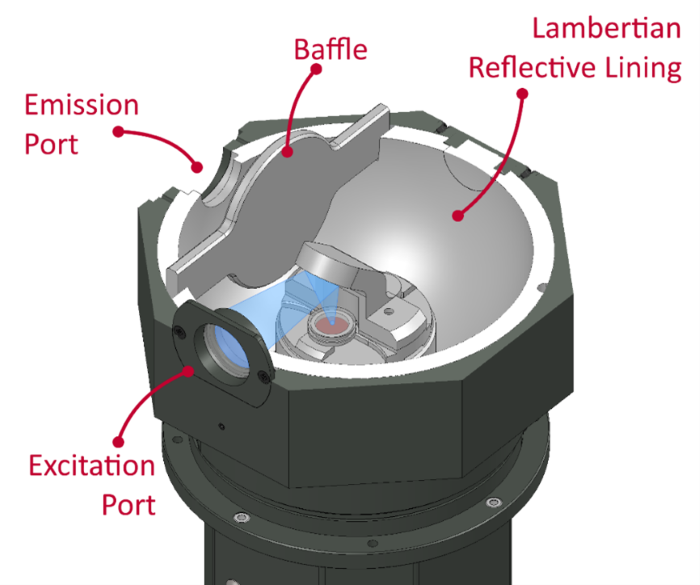
Edinburgh Instruments QYPro® Integrating Sphere Optical Layout. Image Credit: Edinburgh Instruments Ltd
Could you walk us through a typical absolute PLQY measurement workflow? What are the key steps, and what considerations go into setting up a reliable experiment?
Selecting the excitation wavelength is the first step in the measurement workflow. The key is to choose a wavelength that's well-separated from the sample’s emission spectrum. This separation is essential as it allows us to clearly distinguish between scattered excitation light and the photoluminescence emission.
Next is to select the excitation and emission parameters appropriate for the experiment. Both the blank and the sample should be measured using the same parameters. The ideal parameters provide a good signal-to-noise ratio (SNR) for the sample's emission and avoid saturation when measuring the scattered excitation light from the blank.
The blank, which typically measures the solvent or substrate in the integrating sphere, generally shows a single peak at the excitation wavelength and is used to quantify the total number of excitation photons entering the sphere. In contrast, the sample measurement typically has two main features: the scattered excitation light (reduced due to sample absorption) and the photoluminescence emission. Once both the blank and sample measurements are collected, the PLQY can then be calculated.
The number of photons absorbed is determined by subtracting the integral of the scattered excitation light in the sample measurement from that in the blank. The number of emitted photons is determined by the integral of the sample emission peak minus the background signal from the blank measurement in the same spectral region. Dividing the number of emitted photons by the number absorbed then gives the PLQY.

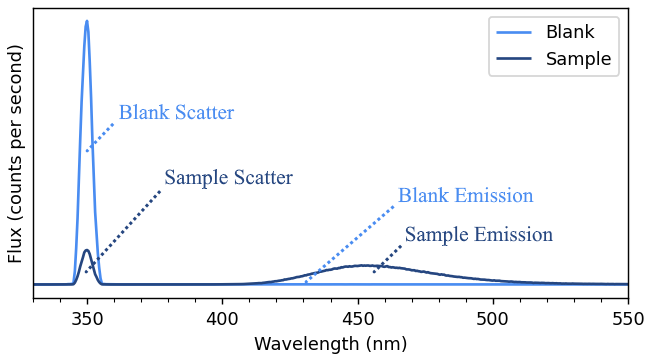
Example PLQY data with 350 nm excitation. Image Credit: Edinburgh Instruments Ltd
What are some of the most commonly encountered problems or pitfalls when attempting to measure absolute PLQY using integrating spheres?
One of the most critical aspects of accurate PLQY measurement is applying an appropriate emission correction. This requires a well-calibrated integrating sphere setup accurately accounting for optical throughput of the instrument and wavelength-dependent sensitivity of the detector. Without proper calibration, the observed excitation and emission intensity at the detector can be significantly different from the true flux within the integrating sphere, leading to incorrect determination of PLQY. Radiometric calibration of integrating spheres is a technically challenging process. Fortunately, most manufacturers today provide their systems fully calibrated and ready to use.
The second most important consideration when working with an integrating sphere is avoiding contamination. A contaminated integrating sphere can no longer produce accurate PLQY results due to absorption and emission from the contaminants. The importance of good, clean working practice cannot be exaggerated when using an integrating sphere.
Another mistake I have seen is failing to use identical parameters for the blank and sample measurements in a PLQY experiment. For example, the user may try to increase the SNR of their sample data by increasing the integration time, number of repeats, or excitation intensity. If these changes are not mirrored in the blank measurement, the calculated PLQY will be incorrect.
Subtle inaccuracies can also be introduced by not using the emission region of the blank as part of the PLQY calculation. Theoretically, the blank does not emit and therefore subtracting zero from the sample emission should give the correct PLQY; however, in practice, stray light from the excitation or background counts from the detector can influence the results. This is why it is recommended to calculate the number of emitted photons with the method previously discussed.
You mentioned stray light as a potential issue when using integrating spheres. What does stray light typically look like in a PLQY experiment, and how can it be corrected?
Stray light in a PLQY experiment typically appears as shoulders around the scattered excitation peaks or as an elevated baseline. This signal does not originate from photoluminescence but rather from scattered excitation light that reaches the detector without being properly eliminated by the optical pathway. This occurs in integrating sphere measurements as the scattered excitation light is collected by the sphere and guided towards the emission channel of the instrument. If not accounted for, it can lead to an overestimation of the blank background signal and thus an underestimated PLQY value.
To identify this effect, one can examine the baseline of both the blank and sample spectra in the region between the excitation peak and the onset of sample emission. Theoretically, there should be no emission from the blank or the sample in this region, and the two baselines should match. However, in highly absorbing samples, the baseline of the blank measurement can be higher than that of the sample. This occurs because the sample absorbs excitation light, while the blank does not, resulting in more stray light reaching the detector during the blank measurement.
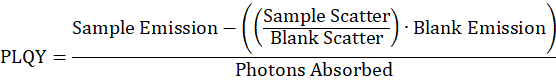
A common mathematical approach to correct for this is to scale the emission region of the blank down by the proportion of excitation light not absorbed by the sample. The calculation for PLQY then becomes:
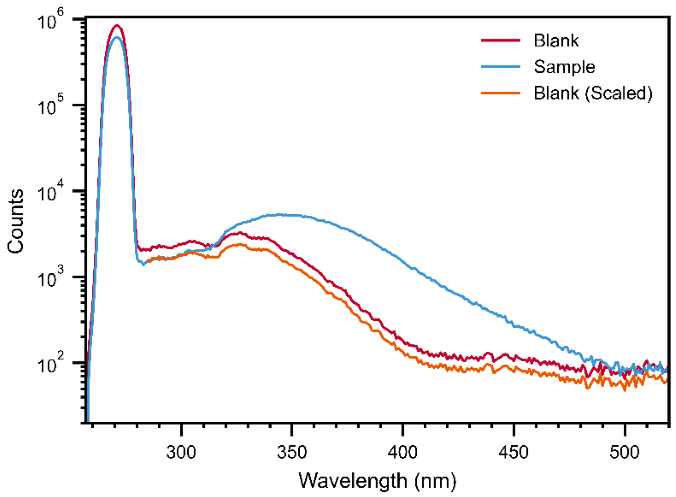
Example data showing the process of sphere background correction. Image Credit: Edinburgh Instruments Ltd
How do you approach the issue of inner filter effects in PLQY measurements, particularly when working with strongly absorbing or low-Stokes shift samples?
Samples with a low Stokes shift are particularly susceptible to secondary inner filter effects, often referred to as reabsorption. This occurs when the sample absorbs some of its own emitted photons before they can be detected.
When working with an integrating sphere, this effect is more pronounced than in conventional PL setups because the emitted light is reflected within the sphere multiple times, increasing the likelihood that emission photons will pass through the sample again and be reabsorbed. This reabsorption leads to an underestimation of the true emission signal of the sample and, consequently, a lower observed PLQY.
The simplest method to account for this is to dilute the sample to reduce the number of photons reabsorbed. However, this approach is not so robust and is not feasible for samples such as single crystals. In such cases, one alternative is to measure the sample outside the integrating sphere using a conventional PL setup. By comparing the emission spectrum of the sample without a sphere to that obtained inside the sphere, it’s possible to estimate the proportion of emission lost due to reabsorption.
This is done by normalizing both spectra at the red end of the emission region, where sample absorption is minimal. The integrals of the tail-matched spectra are then compared to determine the proportion of emission lost to reabsorption. This value can be used to correct the measured emission signal and account for the secondary inner filter effect. The corrected PLQY can then be calculated using the modified equation shown below:
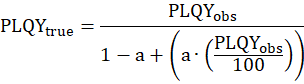
Where a is the proportion of light reabsorbed, determined as follows:
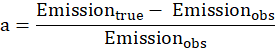
Example data from rhodamine-6G showing sample reabsorption when comparing the true emission spectrum to the observed emission in an integrating sphere. Image Credit: Edinburgh Instruments Ltd
How do you approach PLQY measurements for weakly emissive samples? Are there specific techniques or adjustments that help improve data quality in these cases?
Weakly emissive samples present a particular challenge in PLQY measurements due to their low SNR. To overcome this, high-intensity excitation is often needed to increase the emission signal so that it rises well above the background noise. However, the high-intensity excitation can exceed the dynamic range of the detector, leading to signal saturation when recording the scattered excitation regions.
To address this, the excitation and emission regions of both the blank and the sample can be split into separate acquisitions. The emission spectrum is measured using high-intensity excitation to ensure adequate SNR, while the scattered excitation light is measured separately using a neutral density (ND) filter placed in the excitation pathway before the integrating sphere. The ND filter attenuates the excitation beam, reducing the photon flux and allowing the detector to record the scattered excitation signal without saturating. This approach ensures that both the emission and excitation regions are recorded within the linear range of the detector, with sufficient SNR to allow accurate peak integration and PLQY calculation.
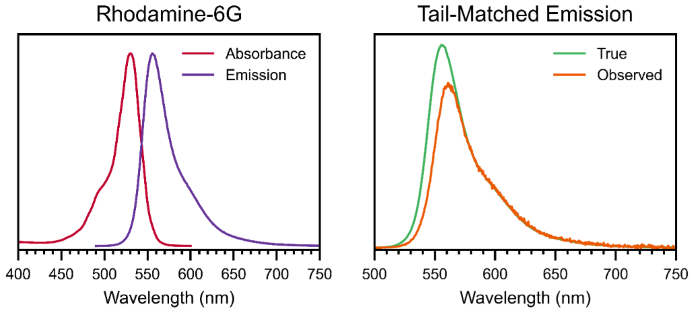
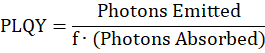
When using this method, it is important to maintain consistent measurement parameters between all individual data acquisitions, with the only change being the ND filter. The PLQY must then be calculated only after the scattered excitation regions have been scaled to reverse the effect of the ND filter. This is done by determining the absorbance (A) or transmittance (%T) of the ND filter at the excitation wavelength, and using this to determine the scaling factor (f) to apply to the scattered excitation regions as follows:
What advice would you give to researchers new to PLQY measurements who are trying to validate or benchmark their systems? Are there standard materials or calibration routines you'd recommend?
I always begin by validating the instrument and optics before taking any measurements. First, I ensure that both the excitation and emission wavelength calibrations are correct. Second, I inspect the integrating sphere for contamination using ultraviolet light and remove any dust or debris using a squeeze-bulb air duster, never an aerosol duster, as the propellant can permanently contaminate the sphere.
After confirming wavelength calibration and the cleanliness of the integrating sphere, I next validate the radiometric calibration by measuring a known sample. The selection of an appropriate reference sample is important. The ideal reference sample is the following:
- Well-characterized in literature or has a certified PLQY/certificate of calibration
- Absorbance at the same wavelength as your sample of interest
- Emission at the same wavelength range as your sample of interest
This validation should be performed regularly, for example, once per month, to help identify contamination events or drift in the calibration over time. This is particularly important when working with samples excited in the UV, where integrating sphere linings are not 100 % reflective and are more susceptible to changes over time, for example, from the accumulation of airborne contaminants.
In fact, contamination prevention is the single most important thing when working with an integrating sphere, as contamination is often irreversible. This is always the first piece of advice I give to new users of integrating spheres. It was also one of the main driving factors behind the electronic sample loading mechanism of our QYPro® integrating sphere.
This mechanism enables sample exchange to occur outside the sphere, significantly reducing the risk of contamination when compared to designs which require the user to reach inside the sphere.
QYPro® sample exchange mechanism. Image Credit: Edinburgh Instruments Ltd
Looking ahead, where do you see developments in PLQY measurement going—are there new materials, techniques, or automation improvements that might simplify or improve this kind of spectroscopy?
From my perspective, having spent hundreds, if not thousands, of hours working in the calibration of integrating spheres, I would love to see PLQY certified reference materials further into the NIR. Perhaps some kind of PbS quantum dot-doped ceramic, or a similar broad emission, high-stability material covering the range of NIR-PMTs. My ideal sample would be solid-state, stable over many years, and have smooth, broad absorbance and emission properties spanning hundreds of nanometers.
From a user perspective, though, I think there would be huge value in a diagnostic tool that provides real-time feedback to help users capture the best possible data for accurate PLQY results. It could be possible to probe the relationship between measurement parameters, sample properties, and PLQY outcomes – then use this information to deliver real-time feedback to the user when a particular correction or adjustment might improve the reliability of their results. Perhaps the use of an AI model trained with a huge variety of real-world examples would allow this to be developed.
About Grant Cumming 
Grant Cumming joined Edinburgh Instruments as a Project Scientist in 2023, with a primary focus on the radiometric calibration of photoluminescence spectrometers. His work centres on the calibration of integrating spheres and enhancing the robustness of quantum efficiency measurements.

This information has been sourced, reviewed and adapted from materials provided by Edinburgh Instruments Ltd.
For more information on this source, please visit Edinburgh Instruments Ltd.
Disclaimer: The views expressed here are those of the interviewee and do not necessarily represent the views of AZoM.com Limited (T/A) AZoNetwork, the owner and operator of this website. This disclaimer forms part of the Terms and Conditions of use of this website.