Determining the oil content of dried snack foods is essential for quality control, ensuring compliance with nutritional value specifications.
The amount of oil used is also important due to the high cost of raw materials and its potential influence on texture and perceived product quality.
Advantages of NMR
Solvent extraction methods are often employed to determine fat content. However, these techniques are typically slow, labour-intensive, imprecise, and require experienced operators. Moreover, many of the often hazardous chemicals used are increasingly restricted under international environmental regulations.
Despite these limitations, solvent extraction remains a reference measurement for quality control. Instrumental methods are frequently classified as secondary techniques because they are typically calibrated to align with the results obtained from solvent extraction.
To provide a result equivalent to conventional extraction methods, these secondary techniques must be calibrated against the chosen reference method.
Although many secondary techniques are fast and easy to maintain, they require regular recalibration and upkeep. Maintenance and consumables also contribute substantially to ownership expenses. For instance, while Supercritical Fluid Extraction (SFE) is relatively fast, it demands high maintenance and the cost of compressed CO2 used to extract oil is significant.
Near Infrared (NIR) is widely employed for online monitoring, but is difficult to apply to opaque samples, as it can only scan the surface. Calibration is also complex as measurements are sensitive to factors such as product granularity and spices, making it difficult to maintain accuracy across different product types. Consequently, NIR has limited applicability for oil content quality control in snack foods.

Image Credit: DenisMArt /Shutterstock.com
In contrast, Nuclear Magnetic Resonance (NMR) provides a straightforward, precise, and cost-effective method for determining oil content in snack foods and is regularly employed in manufacturing facilities worldwide.
Method
Benchtop NMR detects signals from oil and differentiates them from those of solids and bound water (<10 % moisture).
Calibration
Although a primary calibration can be produced using a single oil sample (100 %), Calibration Maintenance Samples (CMS) that exhibit long-term stability can be allocated to reference concentrations (typically 10, 25, and 40 %).
During routine checks, the mid-range SUS is used to confirm that instrument performance remains within acceptable limits. If results deviate from these limits, the low and high SUSs are used to recalibrate the instrument.
The results are comparable to those obtained by acid hydrolysis followed by Soxhlet extraction (e.g., Weibull-Stoldt), which determines total oil content.
When results must match those from Soxhlet, a representative sample set will need to be measured using both NMR and Soxhlet to determine the skew and bias introduced by the 100 % oil calibration. In the long term, only a single calibration needs to be maintained.
Measurement
Using a dedicated packing tool, a sample vial is tared and then filled to a specified height with the sample. Each sample is subsequently weighed before being placed in a conditioning block for 20 minutes. The conditioning temperature is typically 40 °C, matching the magnet temperature, to ensure optimal accuracy.
Certain oils, especially palm oil, require a higher conditioning temperature to ensure complete melting.
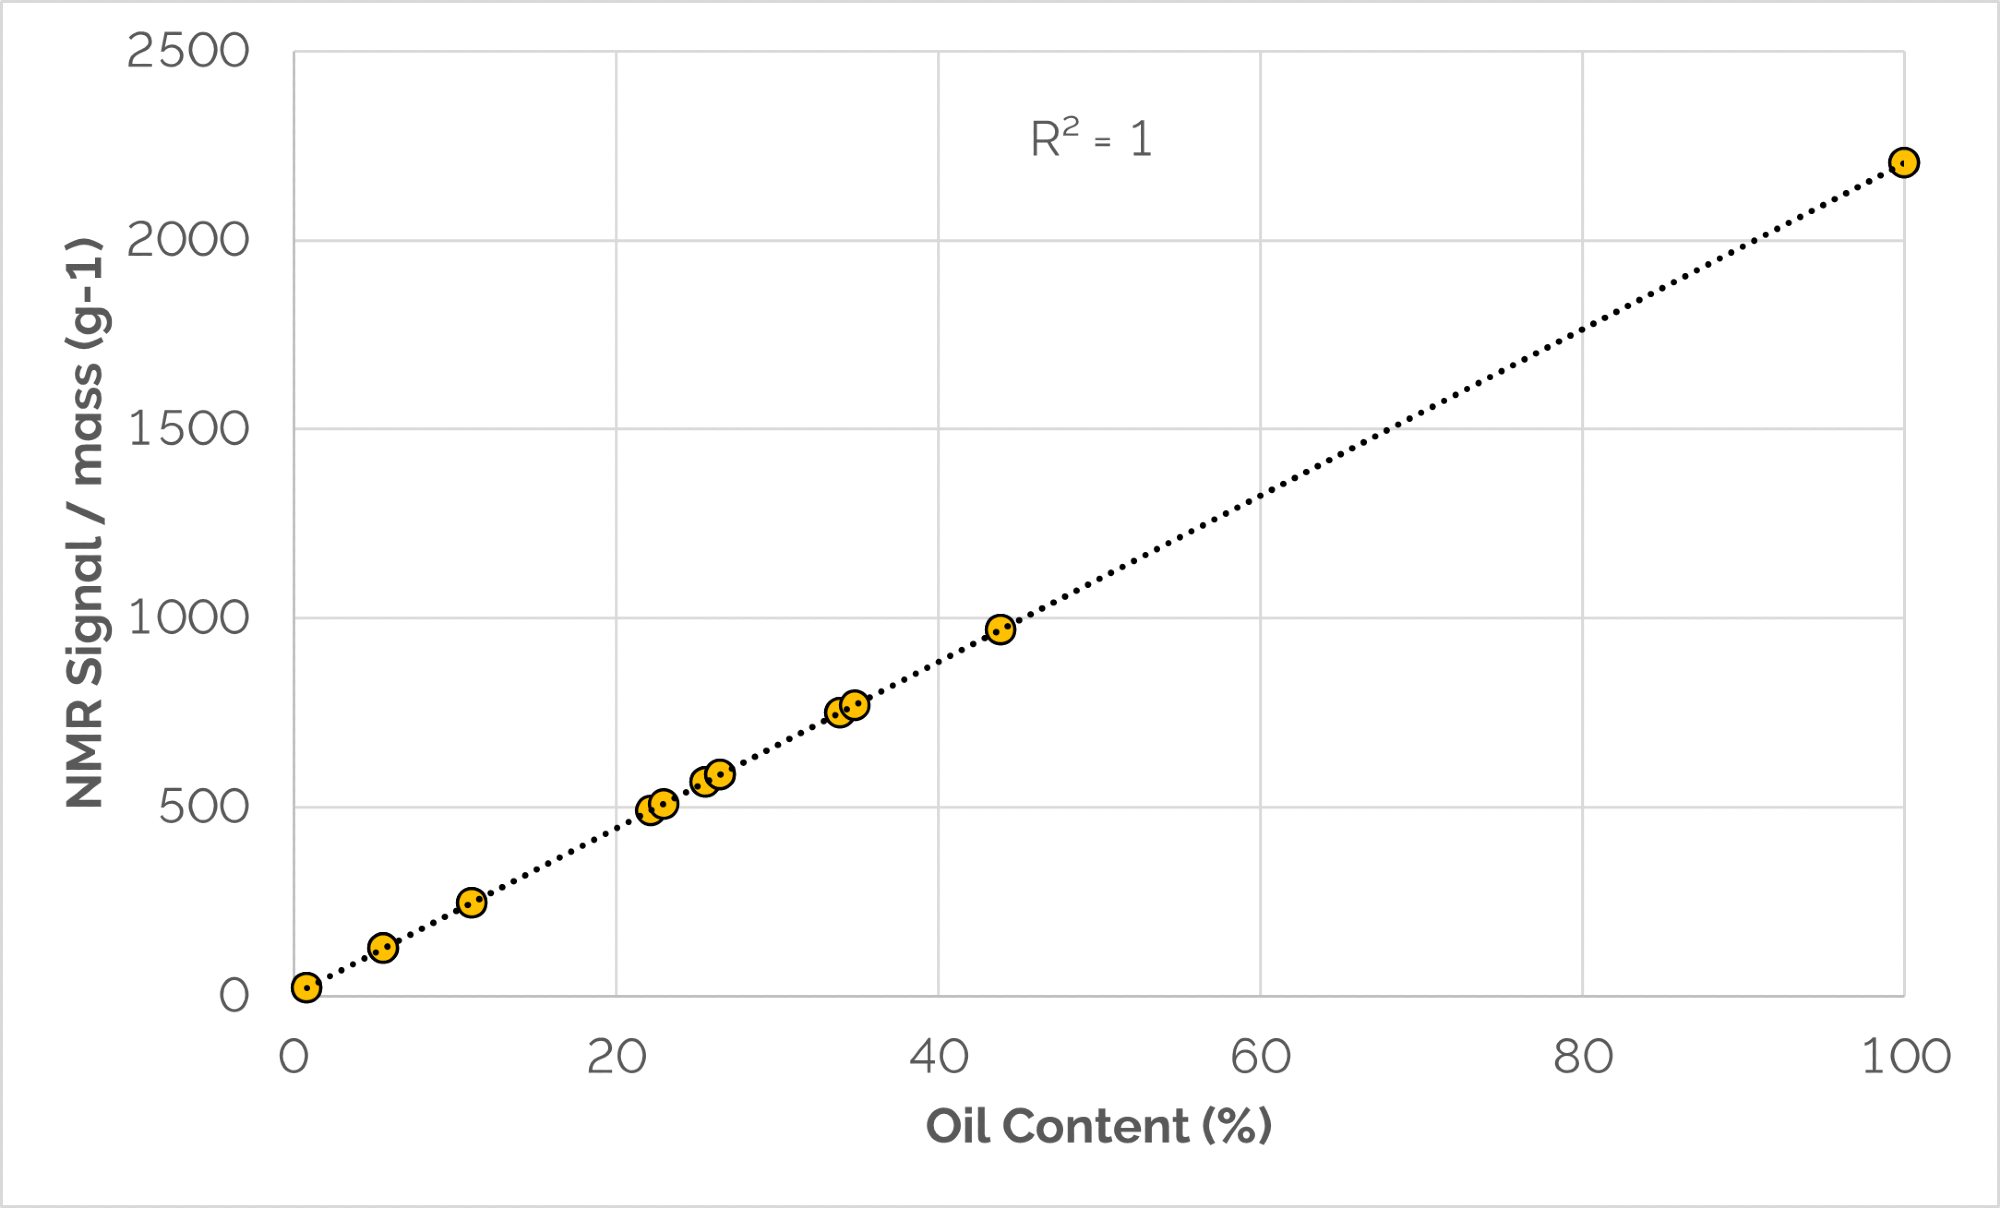
Figure 1. Correlation between NMR signal/mass and reference values. Image Credit: Oxford Instruments
Results
Table 1 summarizes the outcomes of multiple samples selected based on their characteristic compositions and manufacturing processes. The oil contents determined by NMR are compared with those obtained using the reference method, which in this case is solvent extraction.
In Figure 1, the NMR data (signal/mass) plotted against the reference values demonstrate NMR technique accuracy, as all data points align on a straight line and the results are relative to the NMR signal of 100 % corn oil from which the samples were produced.
Table 1 also indicates no significant effect arising from crushing or thoroughly grinding the samples. Moreover, when comparing different oil types, there is no significant difference between fresh and processed corn oil.
Table 2 shows the excellent repeatability (or precision) of the measurement on the same sample, while Table 3 exhibits minimal differences in apparent oil content between corn, sunflower, cottonseed and even palm oil due to variations in their hydrogen density.
Table 1. Comparison between NMR results and reference values obtained from solvent extraction. Source: Oxford Instruments
| Snack Product |
Ref % |
NMR (%) |
Diff (%) |
| A crushed |
0.83 |
0.91 |
0.08 |
| A ground |
0.83 |
1.00 |
0.17 |
| B crushed |
5.59 |
5.46 |
0.13 |
| B ground |
5.59 |
5.64 |
0.05 |
| C crushed |
11.07 |
11.00 |
-0.07 |
| C ground |
11.07 |
11.04 |
-0.03 |
| E ground |
22.18 |
22.44 |
0.26 |
| F ground |
22.98 |
23.29 |
0.31 |
| G crushed |
25.58 |
25.02 |
-0.56 |
| G ground |
25.58 |
25.11 |
-0.47 |
| H crushed |
26.51 |
26.60 |
0.09 |
| H ground |
26.51 |
26.60 |
0.09 |
| I crushed |
33.96 |
34.06 |
0.10 |
| I ground |
33.96 |
33.68 |
-0.28 |
| J ground |
34.84 |
35.01 |
0.17 |
| H crushed |
43.90 |
43.66 |
-0.24 |
| H crushed |
43.90 |
44.34 |
0.44 |
| Corn oil product line 1 |
100.00 |
99.80 |
-0.20 |
| Corn oil product line 2 |
100.00 |
100.37 |
0.37 |
| Standard error of estimate (%) |
0.23 |
Table 2. Repeatability measurements by NMR. Source: Oxford Instruments
| Measurement Number |
Oil content by NMR (%) |
| 1 |
34.74 |
| 2 |
34.69 |
| 3 |
34.80 |
| 4 |
34.70 |
| 5 |
34.77 |
| 6 |
34.69 |
| 7 |
34.72 |
| 8 |
34.79 |
| 9 |
34.74 |
| 10 |
34.71 |
| Standard Deviation (%) |
0.04 |
| Precision (2 x SD, %) |
0.09 |
Table 3. Comparison of NMR measurements on different oils. Source: Oxford Instruments
| Oil type |
Oil content by NMR (%) |
| Corn |
100.00 |
| Cotton seed |
99.12 |
| Sunflower |
99.59 |
| Palm |
99.95 |
Conclusion
- A primary calibration can be created using a single oil sample ,which in practice can cover concentrations ranging from 0 to 100 %. A separate calibration may be necessary for low concentrations
- NMR demonstrates exceptional long-term stability and rarely requires calibration adjustment. If adjustment is needed, it can be easily performed using stable Calibration Maintenance Samples which recreate the original calibration performed during installation
- NMR is virtually unaffected by sample granularity or additives including spices, flavors, colors, and salt
- NMR penetrates the entire sample and is unaffected by air voids, providing the most accurate measurement of total oil content in a given sample volume
- Measurement precision typically exceeds 0.1 % oil
- The NMR technique is non-destructive, allowing repeated measurements of the same sample prior to analysis by alternative methods
- Sample measurement time is short (32 seconds)*
* For optimal precision, samples should be conditioned at 40 °C for 20 minutes in a dry block heater before analysis.

Image Credit: Napat /Shutterstock.com
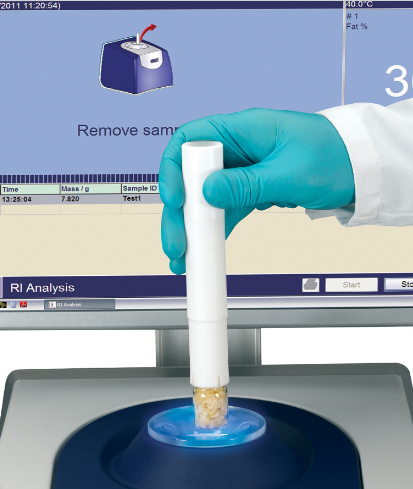
Image Credit: Oxford Instruments
Summary
- As much as 250 times faster than wet chemistry techniques+
- No hazardous solvents required and no hazardous waste generated
- The easiest, most reliable method available; suitable even for inexperienced users through simple, intuitive visual software
- Simple linear calibration; no chemometrics
- Unaffected by sample form and additives Excluding sample conditioning time
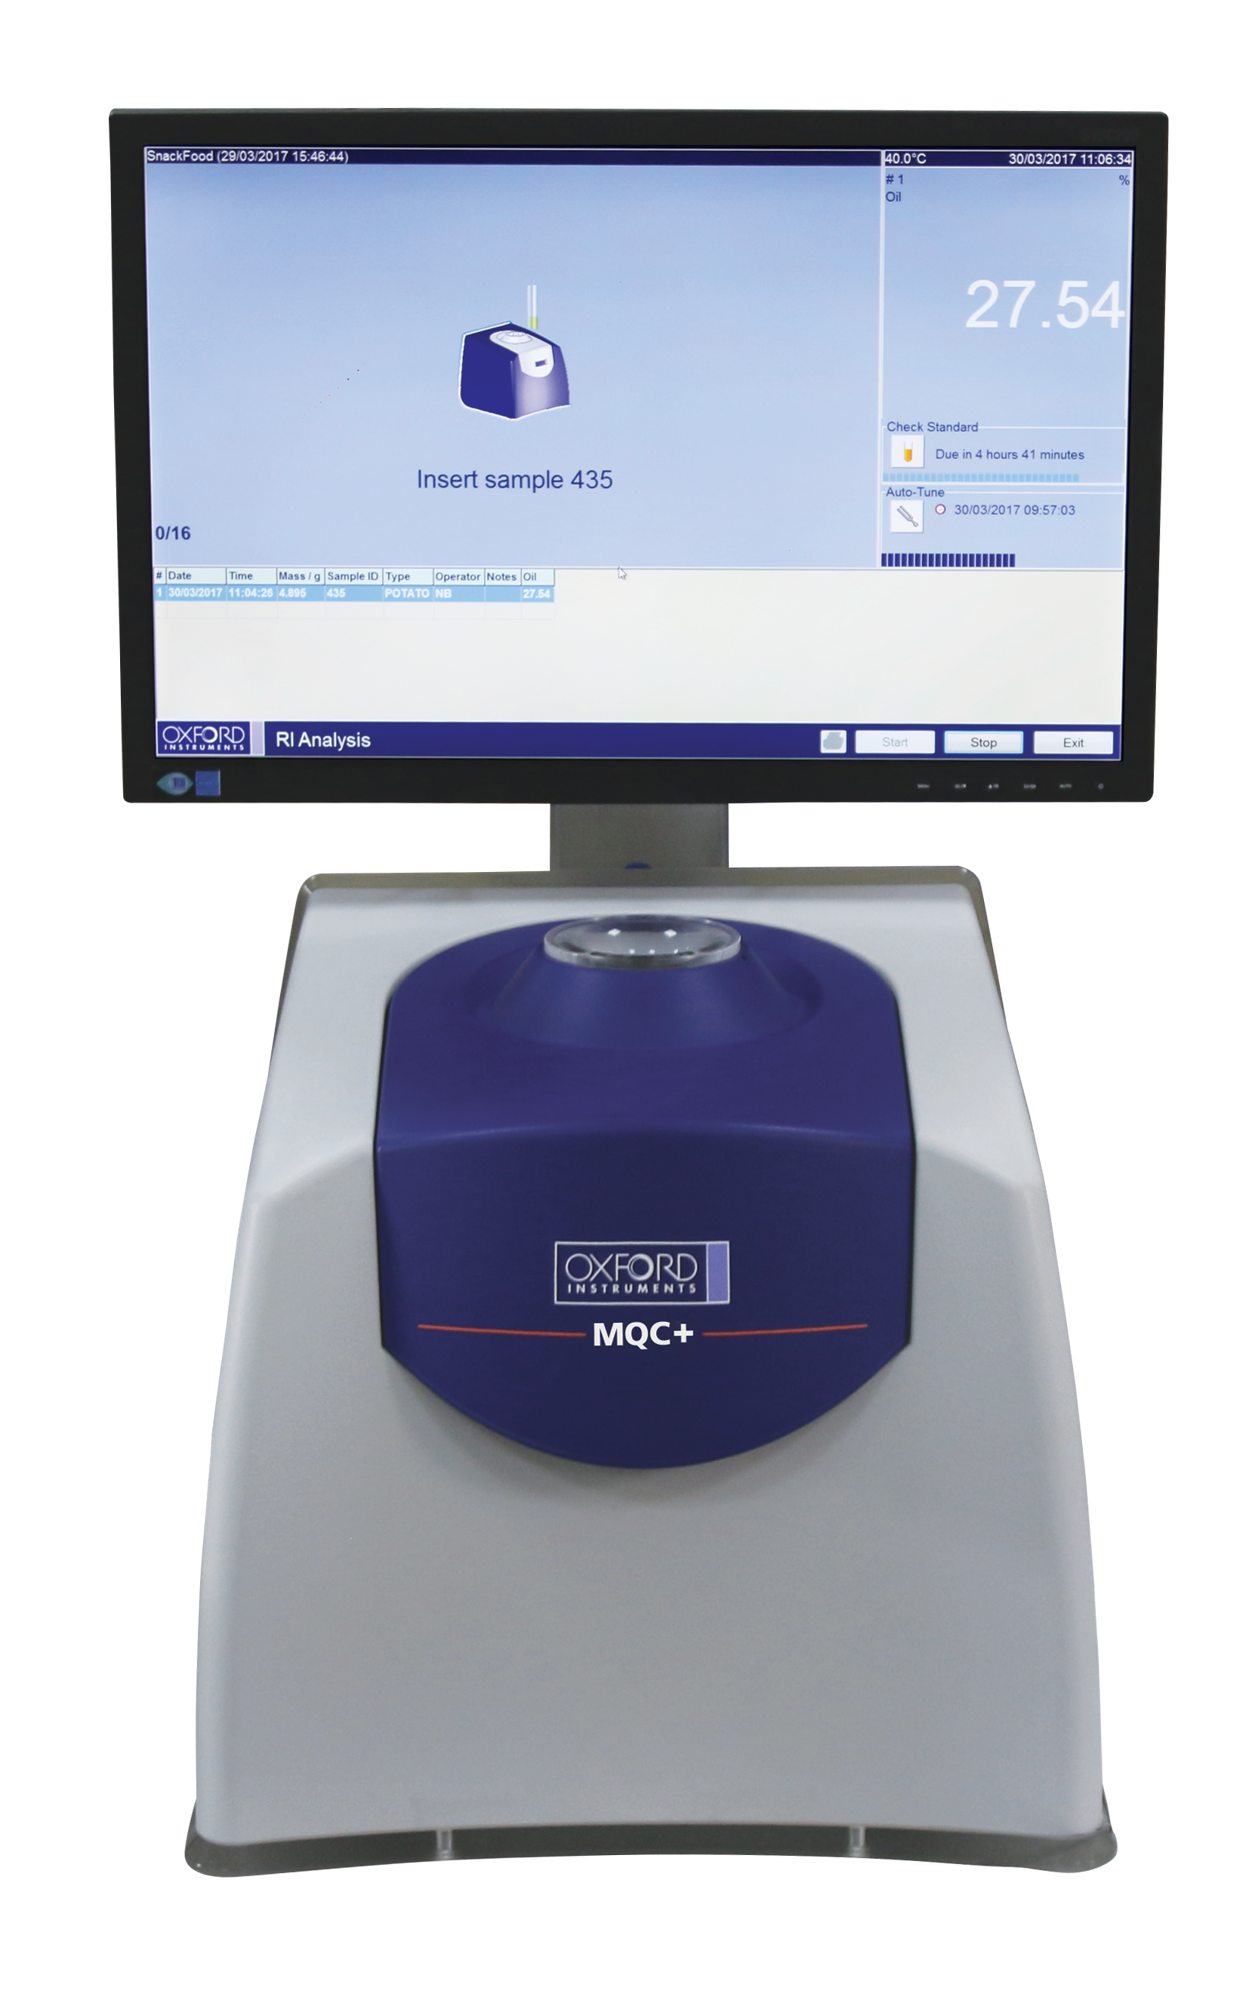
Image Credit: Oxford Instruments

This information has been sourced, reviewed and adapted from materials provided by Oxford Instruments.
For more information on this source, please visit Oxford Instruments.