Cocoa beans are processed to obtain cocoa liquor and cocoa butter, two key ingredients in dark and milk chocolate.
First, the beans are roasted, separated from their shells, and broken into nibs. The nibs are subsequently ground to obtain cocoa liquor or cocoa butter plus cocoa powder.
Given that bean quality can vary according to environmental conditions in the regions where they are grown, quantifying the fat content of raw and intermediate materials is critical to ensure uniformity in the final product.
Summary
- Quick, precise, and repeatable
- Minimal sample preparation required
- Simple calibration using cocoa butter or a set of standards
- Most dependable method available; suitable for non-specialized operators.
Advantages of Benchtop NMR
The International Office of Cocoa, Chocolate and Sugar Confectionery Industries (IOCCC) 14-1972 and AOAC 963.15 techniques involve acid digestion to release bound lipids, followed by extraction with petroleum ether. However, these methods are time-intensive, require experienced operators, and involve the use of hazardous solvents.
The MQC+ benchtop Nuclear Magnetic Resonance (NMR) analyzer provides an alternative to wet chemistry, offering a fast, straightforward, and easy-to-calibrate technique that requires minimal sample preparation. This makes it well-suited for routine operation without the need for hazardous chemicals or specialized operator training.
Method
The analytical technique is based on direct measurements of the NMR response obtained from fat in chocolate products, normalized by the sample mass. Fat content is determined by calibrating the NMR signal per gram of sample against concentration determined using an appropriate reference method.
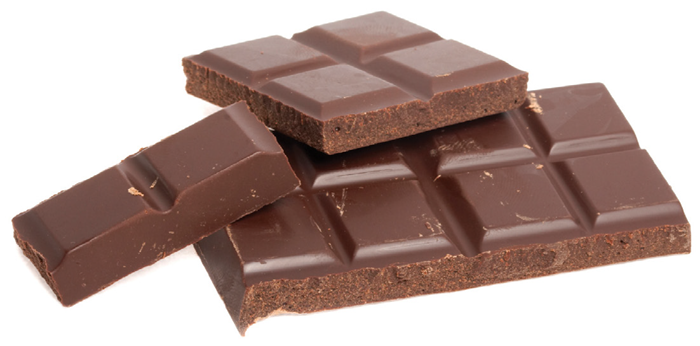
Image Credit: New Africa/Shutterstock.com
Calibration
As the calibration is linear, only two well-established standards are ultimately required to calibrate the instrument. Initially, however, it is recommended to use three to six (preferably more) standards with known fat contents evenly distributed across the target range.
As a comparative technique, NMR cannot exceed the accuracy of the reference technique against which it is being compared. Nonetheless, it is more robust and reproducible than extraction methods. Calibration errors can be reduced by analyzing a larger number of reference samples.
Measurement
Melted chocolate is poured into a pre-tared vial and weighed. The vial is subsequently placed in a temperature-controlled conditioning block at 50 ºC for 20 minutes before analysis. Insertion of the sample into the instrument automatically initiates NMR analysis, and the fat content is displayed after eight seconds.
Results
Calibrations were obtained by analyzing multiple samples of dark and milk chocolate (Figure 1) and chocolate crumb (Figure 2) (a mixture of milk, sugar, and cocoa liquor). The resulting NMR data was then plotted against fat contents determined using the IOCCC reference method.
The results for both chocolate and crumb demonstrate excellent correlations with R values of 0.999 and 0.997, respectively. The reference values are compared against those determined from the NMR calibration in Tables 1 and 2.
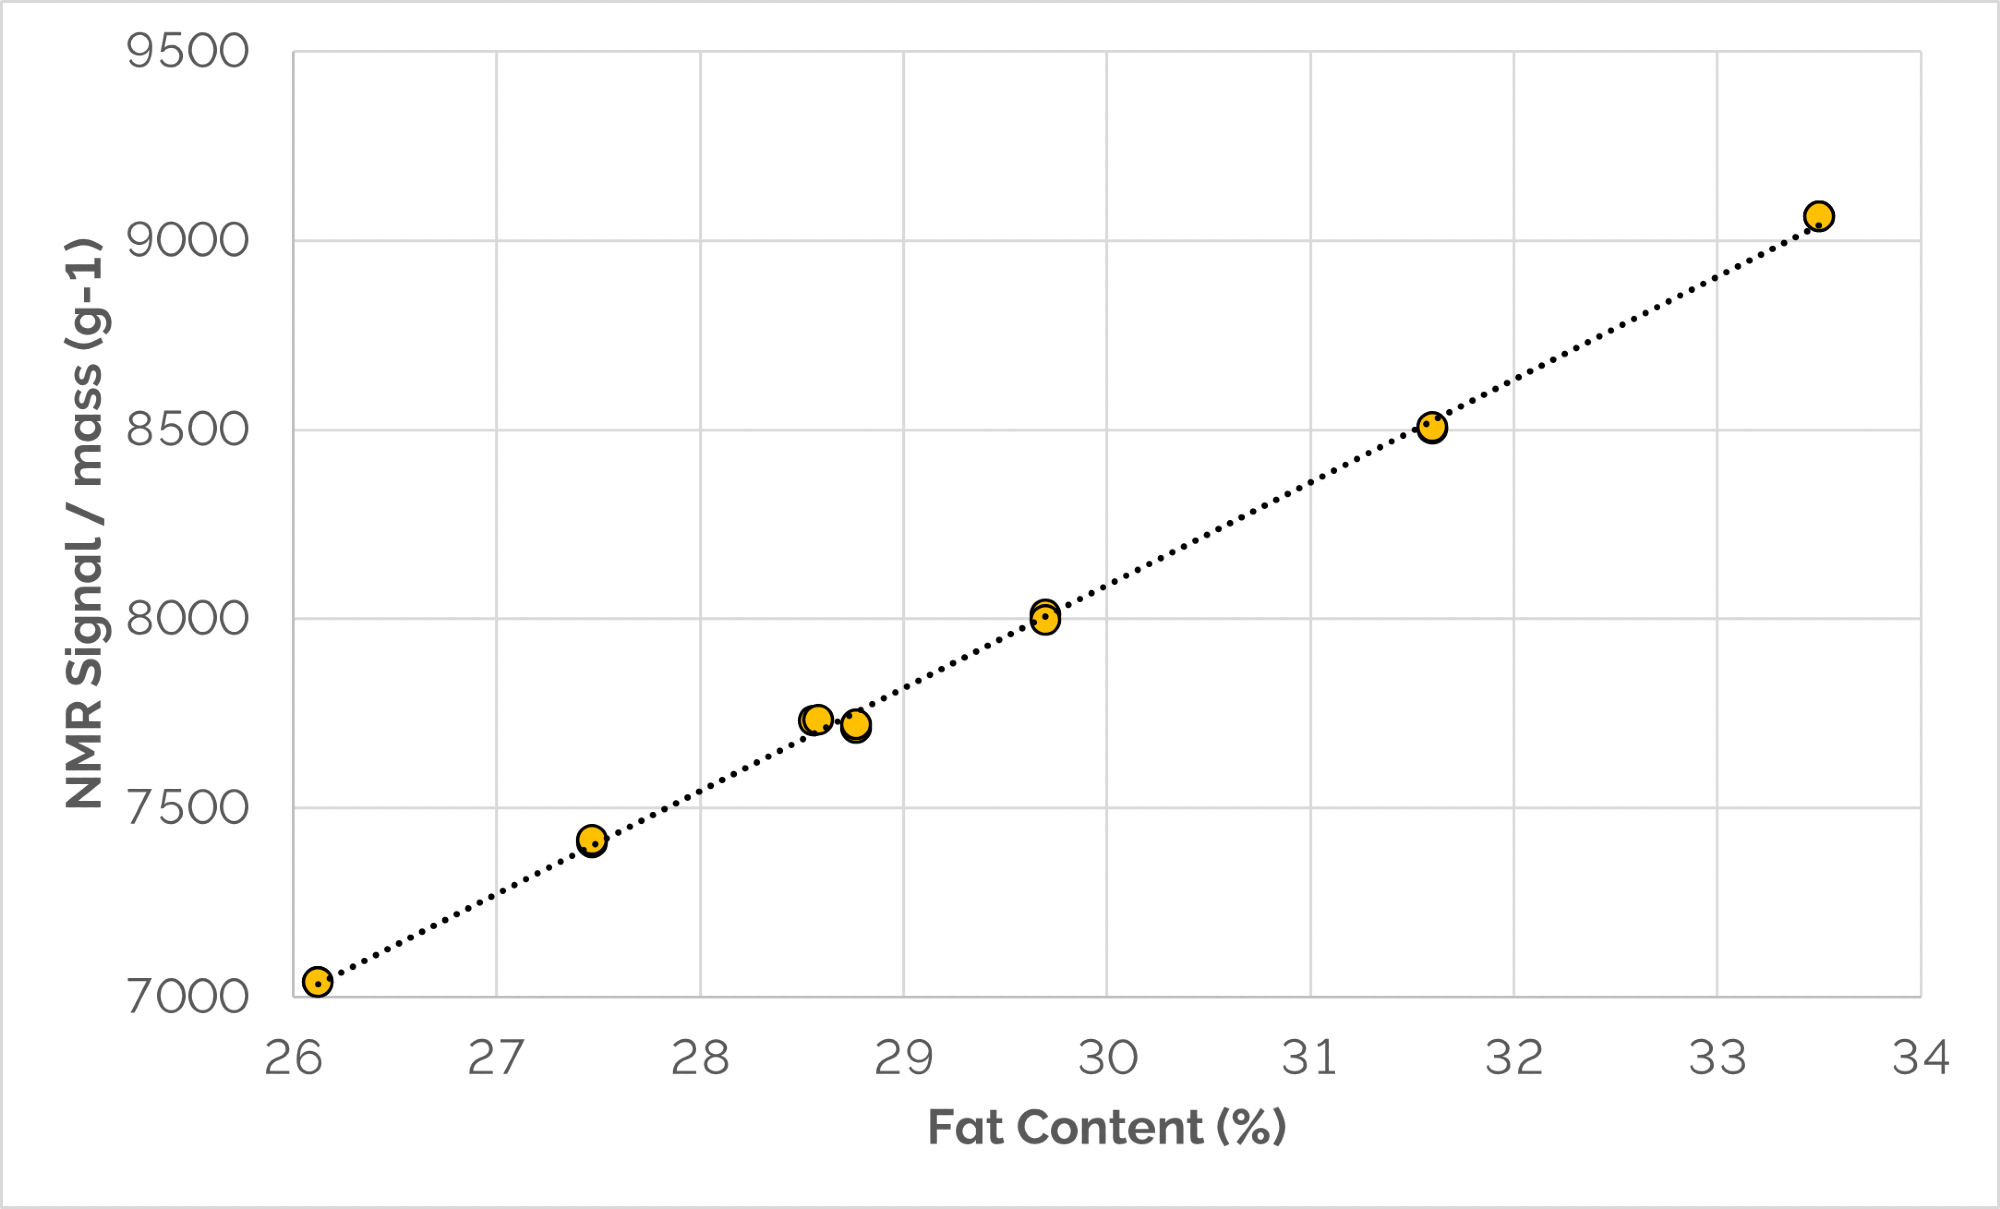
Figure 1. NMR calibration for Total Fat Content of dark and milk chocolate referenced against the IOCCC method. The correlation coefficient (R) and standard deviation (σ) are 0.999 and 0.07 respectively. Image Credit: Oxford Instruments
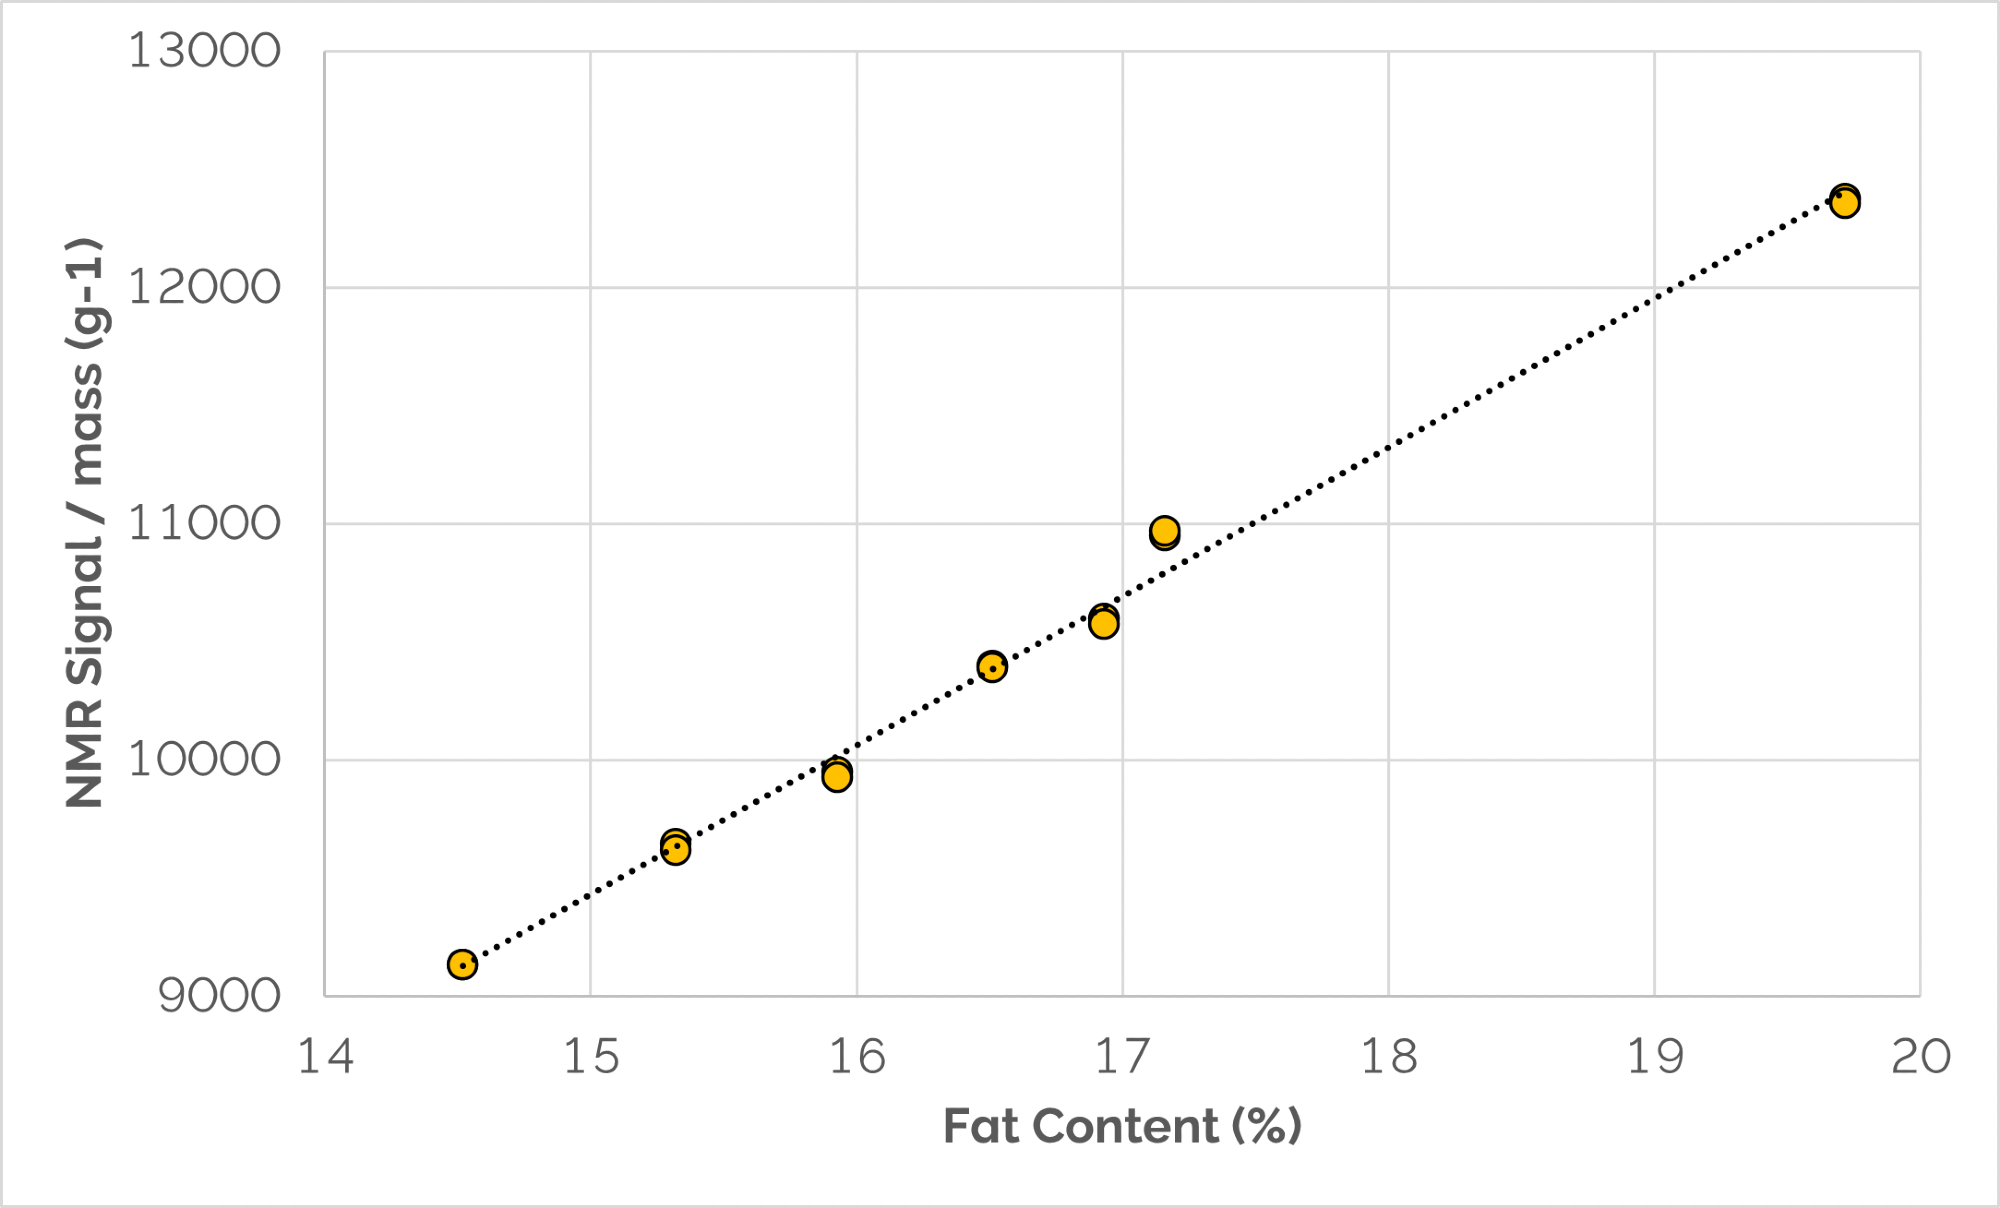
Figure 2. NMR calibration for Total Fat Content of chocolate crumb referenced against the IOCCC method. The correlation coefficient (R) and standard deviation (σ) are 0.997 and 0.12 respectively. Image Credit: Oxford Instruments
Table 1. A comparison of the fat contents of various samples of dark and milk chocolate obtained from the reference technique against those calculated from the NMR calibration in Figure 1. Source: Oxford Instruments
| Sample |
Ref. Value (%) |
NMR Value (%)* |
Diff. (%) |
| 1 |
29.7 |
29.7 |
0.0 |
| 2 |
28.6 |
28.7 |
0.1 |
| 3 |
33.5 |
33.6 |
-0.1 |
| 4 |
27.5 |
27.5 |
0.0 |
| 5 |
26.1 |
26.1 |
0.0 |
| 6 |
31.6 |
31.5 |
-0.1 |
| 7 |
28.8 |
28.6 |
-0.2 |
*Average of two subsamples
Table 2. A comparison of the fat contents of various samples of chocolate crumb obtained from the reference technique against those calculated from the NMR calibration in Figure 2. Source: Oxford Instruments
| Sample |
Ref. Value (%) |
NMR Value (%)* |
Diff. (%) |
| 1 |
14.5 |
14.5 |
0.0 |
| 2 |
15.3 |
15.3 |
0.0 |
| 3 |
15.9 |
15.8 |
-0.1 |
| 4 |
16.9 |
16.9 |
0.0 |
| 5 |
16.5 |
16.6 |
0.1 |
| 6 |
17.2 |
17.4 |
0.2 |
| 7 |
19.7 |
19.7 |
0.1 |
*Average of two subsamples
Conclusions
- A primary calibration can be created using multiple reference samples that span the desired concentration range. Alternatively, a single cocoa butter sample can be used to cover concentrations ranging from 0.5 to 100 %
- NMR demonstrates exceptional long-term stability and rarely requires calibration adjustment
- NMR penetrates the entire sample and is unaffected by air voids, ensuring highly accurate measurement of total fat content in a given sample volume
- Measurement accuracy is superior to that of wet chemical methods, typically <0.1 %
- Sample measurement time is rapid (typically eight seconds)
- The NMR technique is non-destructive, allowing repeated measurement of the same sample before analysis by alternative methods.
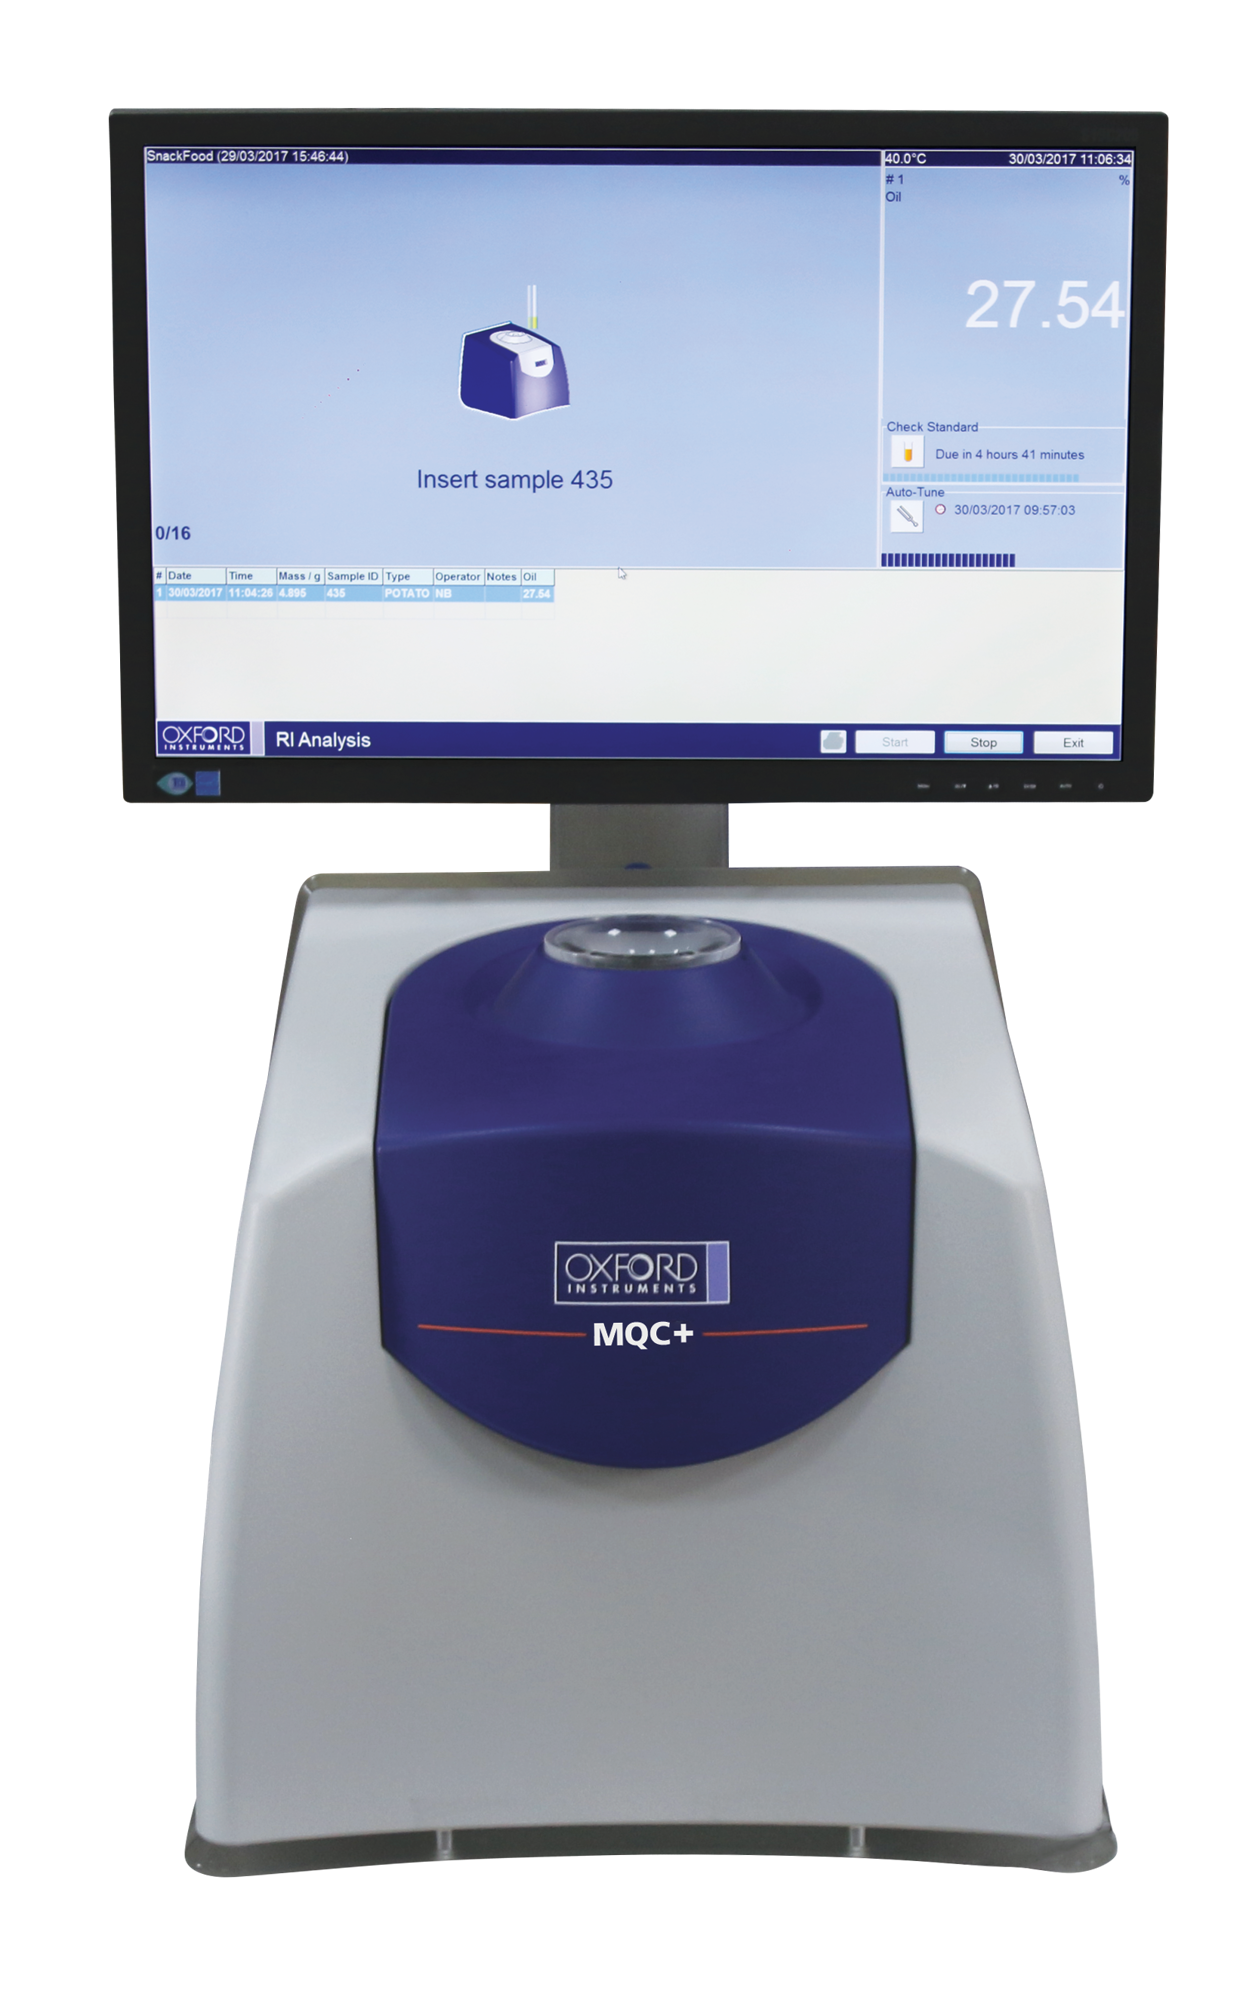
Image Credit: Oxford Instruments

This information has been sourced, reviewed, and adapted from materials provided by Oxford Instruments.
For more information on this source, please visit Oxford Instruments.