In this interview, AZoMaterials speaks with René de Kloe, EBSD and EDS applications specialist at Gatan, about the core strengths of EDAX OIM Analysis 9.
The conversation centers on its powerful analytical capabilities using interactive data selection, partitioning, and indexing tools that allow users to efficiently explore and quantify microstructural features from EBSD datasets. René shares how these functions drive smarter, more efficient materials characterization, from isolating microstructural subsets to refining data quality for more reliable interpretations.
Can you please introduce yourself and your role at Gatan?
My name is René de Kloe, and I’m a senior EBSD and EDS applications specialist at Gatan. I’ve been in the field for many years, helping users understand their materials better by applying our microanalysis tools to their materials and characterization challenges.
My current role includes supporting customers globally in using the EDAX OIM Analysis software, especially focusing on how the partitioning and interactive tools can maximize the insights they can get from EBSD data.
What makes OIM Analysis 9 such a powerful tool for EBSD analysis?
OIM Analysis 9 is designed to be an full-featured intuitive and interactive tool that gives users maximum control over how they explore and interpret their EBSD data.
One of the key strengths is that it's not just about creating colorful maps, but about selecting and optimizing data in a meaningful way. It allows you to dig deeper by interactively selecting specific parts of your datasets by filtering and partitioning to reveal complex microstructural details.
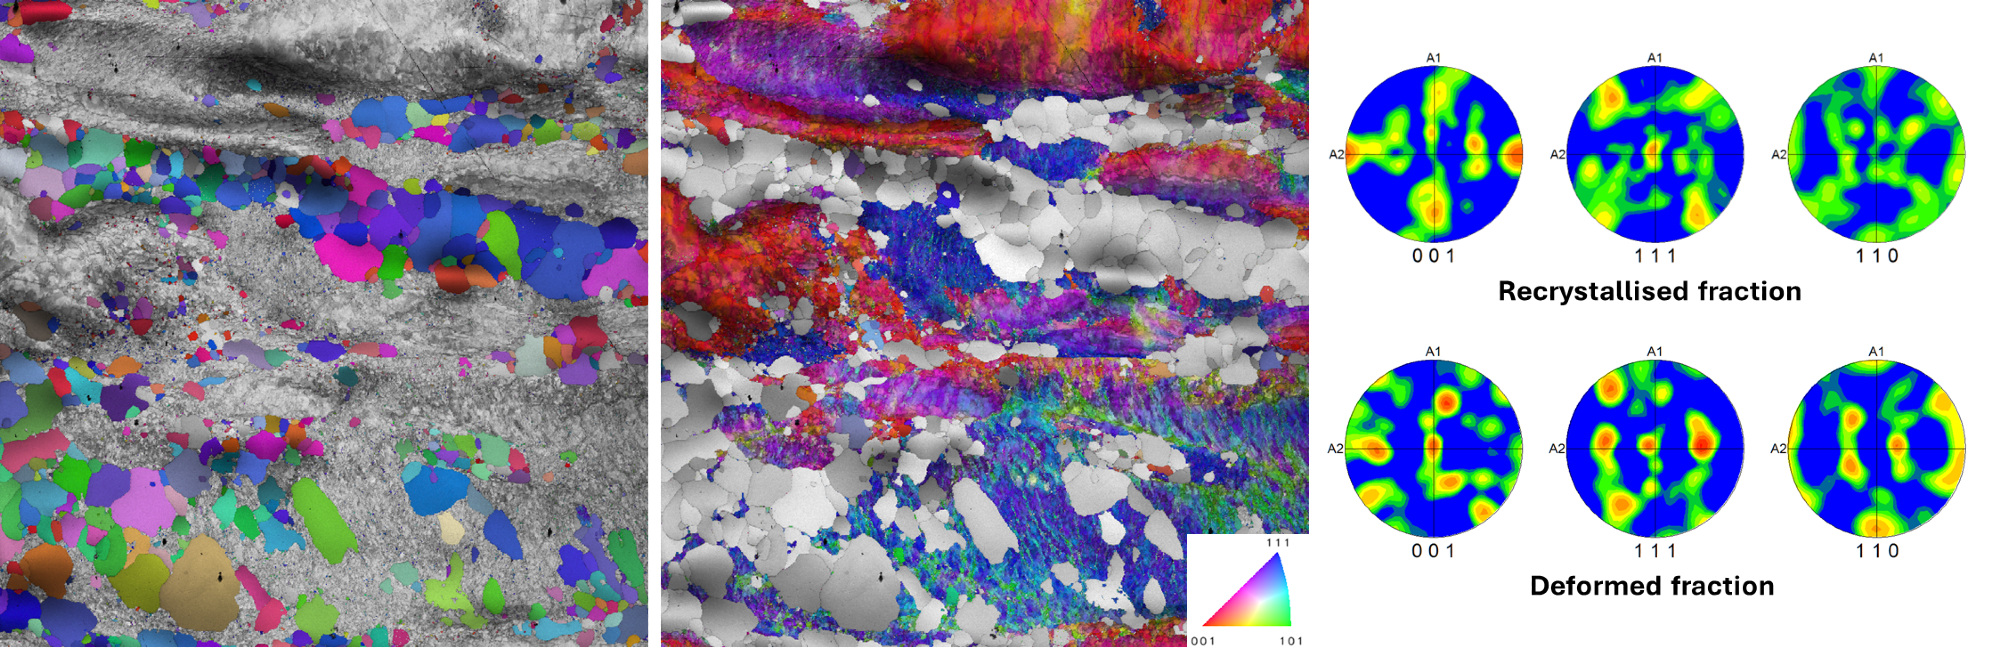
IPF orientation maps of (left) recrystallized and (center) deformed regions overlaid on grayscale image quality (IQ) maps with (right) corresponding pole figures, showing the crystallographic texture of both components. Image Credit: Gatan, Inc.
Partitioning plays a central role. How does it work and why is it useful?
Partitioning is one of the most powerful features in OIM Analysis. It allows you to isolate specific grains or areas of interest within a dataset. For example, you can use it to select grains that are recrystallized based on variations in internal orientation, or to recognise retained austenite in dual-phase steels.
You can define partitions based on parameters like phase, orientation, deformation or even manual selection from maps or charts. These partitions help you focus your analysis only on the relevant parts of the microstructure, making it easier to interpret complex materials.
How does interactive data selection enhance the analysis?
One of the biggest advantages is the interactivity between maps, plots, and charts. When you select a specific feature in a pole figure or histogram, all corresponding grains are instantly highlighted across all other views. The selected points can then be separated into a new partition for detailed analysis.
This kind of dynamic linking makes it much easier to spot patterns and understand how different features relate. It also helps surface trends or outliers that might be missed in a generic analysis only using full maps.
You also showed several optimization features during the webinar. Could you explain those?
Yes, OIM Analysis includes a range of tools to help optimize your data. For example, you can filter out low-confidence index (CI) points using interactive selection and then optimise the indexing parameters for these points to maximise the indexing success. You can even use points that still do not produce valid orientations to define and characterise pores.
These features make it easy to refine data quality step by step, with immediate visual feedback. It’s a user-friendly way to get your dataset in good shape before diving into quantitative analysis.
Can you give an example from the webinar where these tools made a big difference?
One good example was analyzing a zinc alloy sample that was initially indexed with only 75% success rate. By partitioning the missed points using the confidence index and applying off-line image processing tools like Neighbor Pattern Averaging and Reindexing (NPAR), the indexing success of the map could be improved to almost 100%. With such an indexing result you can be confident that your analysis describes the true structure and you do not have to guess what happens in one quarter of the dataset.
It gave a much clearer view of the microstructural processes at play.
In another case, I was looking at retained austenite in dual-phase steels. Partitioning based on phase and confidence values made it easier to see how complete the phase transformation was. Proper phase selection and indexing also allows reconstruction of the microstructure at high temperature which is no longer accessible after cooling. This is a helpful way to assess the effectiveness of the heat treatment.
Does OIM Analysis 9 support using external data or images in the analysis?
Yes, absolutely. You can overlay EBSD data with external references like elemental maps collected at different microscope conditions or even optical images taken after etching. This allows you to partition your data using outlines or features seen in those images. It adds another layer of insight, especially when crystallographic data alone isn’t enough.
How user-friendly is the software for someone new to EBSD or OIM?
I would say it’s very approachable. There’s a learning curve, like with any powerful software, but OIM Analysis has a great Help system and a consistent feature selection method that guide the user. Once you get the basics of how partitioning and analysis selection work it becomes a very intuitive and flexible tool. When you know how to make one map, you can make them all.
How does all this tie into reporting and sharing your results?
You can create detailed reports using the same partitions and views you've worked on. The software allows you to export images, statistics, and even settings. So if you’ve done a very specific setup with partitioning and map definitions, you can document and save exactly how you generated your analysis. That’s important for reproducibility.
What is the one thing you hope users take away from learning OIM Analysis 9?
I hope users realize how important and powerful partitioning and interactive data selection are for getting meaningful results from EBSD. Instead of just generating generic maps, you’re actively exploring and optimizing your dataset. It turns analysis into a process of discovery rather than just visualization.
About René de Kloe
René de Kloe is a Senior Applications Specialist at Gatan, with expertise in electron backscatter diffraction (EBSD) and energy-dispersive spectroscopy (EDS).
He holds a geology degree from Utrecht University and earned his Ph.D. studying melt microstructures in the upper mantle rocks. With over 25 years of experience in microanalysis and materials characterization, Rene brings a geologist’s perspective to electron microscopy, helping researchers in both academia and industry uncover new insights through EBSD.

This information has been sourced, reviewed and adapted from materials provided by Gatan, Inc.
For more information on this source, please visit Gatan, Inc.
Disclaimer: The views expressed here are those of the interviewee and do not necessarily represent the views of AZoM.com Limited (T/A) AZoNetwork, the owner and operator of this website. This disclaimer forms part of the Terms and Conditions of use of this website.