Dynamic Image Analysis has the potential to match the HIAC Beckman PODS APC, bridging ISO 11171 and ISO 21018-1 when used in fuel and lubrication settings. Image-based particle analysis goes one step further and can actually match this gold standard - and beyond.
From Light Obscuration to Image-Based Insight
Automated Particle Counters (APCs) calibrated with Medium Test Dust (MTD) have historically set the benchmark for fuel and lubrication cleanliness testing. This calibration method is based on ISO 11171, measuring reliable particle counts but lacking shape classification and visual verification capabilities.
The field had no standardized path for alternative technologies until the advent of ISO 21018-1. This new standard embraces emerging techniques that do not conform to national calibration protocols and is especially relevant for systems designed to analyze particle shape, morphology, and source identification.
[Image]
Advantages of the Raptor Dynamic Image Analysis (DIA) System
The Raptor Dynamic Image Analysis (DIA) system is compliant with ISO 21018-1 and complements ISO 11171-calibrated APCs. The Raptor uses MTD suspended in hydraulic fluid to deliver comparable particle counts, with the added benefits of shape-based classification and high-resolution thumbnail images.
This means that users know how many particles are in their system and can understand what these particles are and where they may have originated.
Image Credit: ISO
Testing Protocol: The Raptor Versus APCs
Testing was done according to the following protocol:
- A Beckman Coulter PODS system was used as the APC (Automated Particle Counter).
- A Vision Analytical Raptor system with a 200-micron-width sample cell was utilized as the PCM (Particle Contamination Monitor).
- A calibration standard was created using ISO 11171 as a guideline.
- Typical ISO 11171 calibration standards were created using MTD (Medium Test Dust ISO12103-1, A3 Medium Test Dust from Powder Technology Inc).
- The MTD was suspended in aircraft-grade hydraulic fluid.
- Typical required loading is 2.8 mg/ml, but loading for this test was 10 mg/ml.
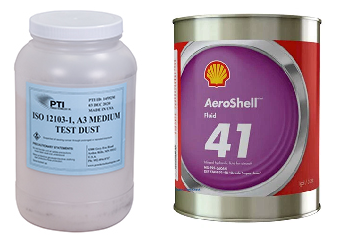
Image Credit: Vision Analytical Inc.
Freshly made calibration material was sufficiently dispersed and shaken before being run on the Beckman HIAC PODS system.
Approximately 100 mL of calibration material was suspended in a clean sample bottle for the APC test. Next, a 5 mL aliquot was drawn into a sterile syringe.
The Raptor system offers numerous means of suspending a sample. To eliminate any outside contamination, a sterile syringe was used to draw in the same sample analyzed with the APC in this instance, and a new sample cell was used.
The analyzed sample was captured using a second sterile syringe. This allowed the sample to be run multiple times, eliminating the potential for contamination.
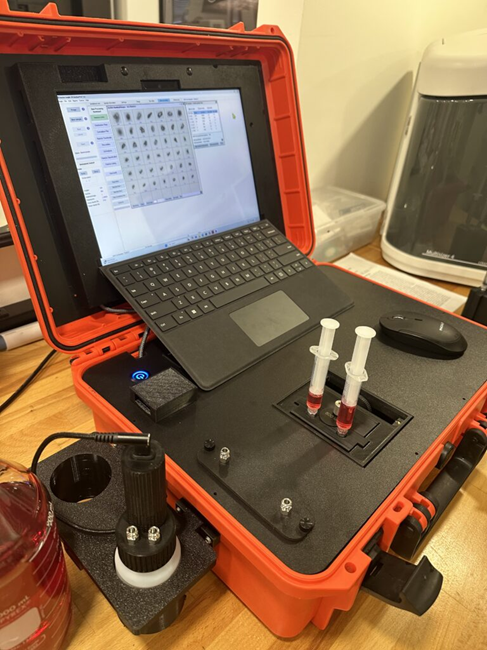
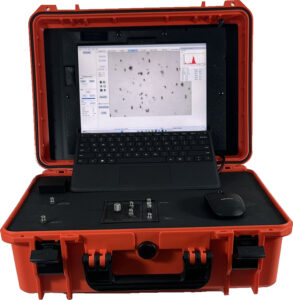
Raptor Particle Contamination Monitoring System. Image Credit: Vision Analytical Inc.
The Raptor can run the bottles typically used for sampling in the fuel and lubrication industries. It can also be used to run samples as a single pass or recirculate these using the same sampling bottle and a self-contained stirring system to ensure proper sample suspension.
The use of syringes is a useful option because they can also serve as sample-collection devices. Running samples with the syringe option maintains the original sample without the risk of external contamination. This consideration made syringes the most ideal suspension option for the MTD calibration fluid.
Test Results
A recent benchmark comparison saw the Raptor used to analyze Medium Test Dust in hydraulic fluid. The Raptor achieved results comparable to those of traditional APC systems.
Thumbnail images acquired via the Raptor offered useful visual confirmation of particle integrity. This allows the user to distinguish between metallic wear particles, soft contaminants, and fiber-based intrusion.
Shape descriptors enabled the early detection of irregular or failure-prone particles, enabling proactive implementation of preventive maintenance decisions.
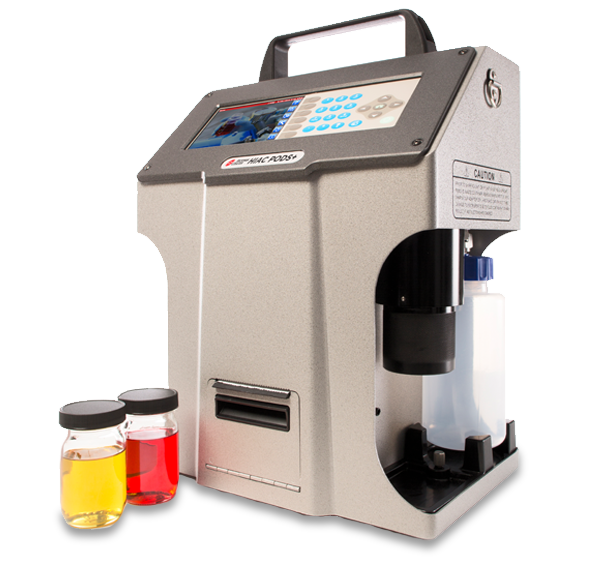
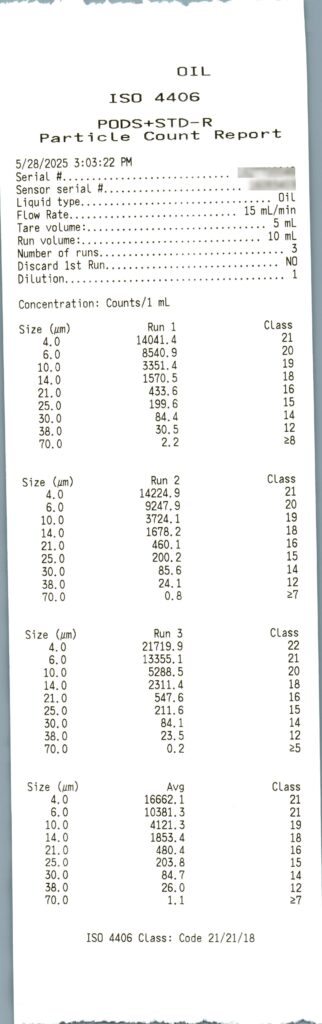
HIAC PODS+ Portable Industrial Particle Counter. Image Credit: Vision Analytical Inc.
HIAC PODS + data showed that the third run was very high compared to the other runs. This run was eliminated from the average, with the resulting average determined to be:
Source: Vision Analytical Inc.
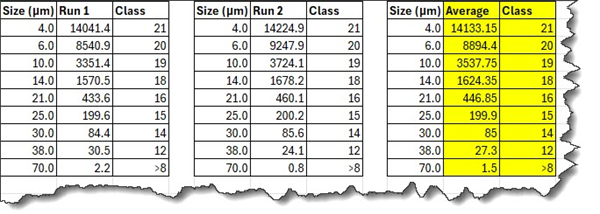
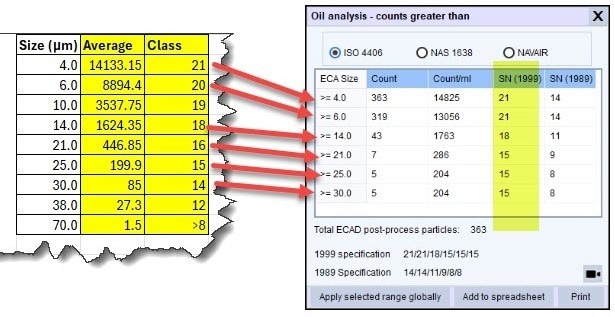
The Raptor system reports were:
Raptor vs HIAC PODS+. Image Credit: Vision Analytical Inc.
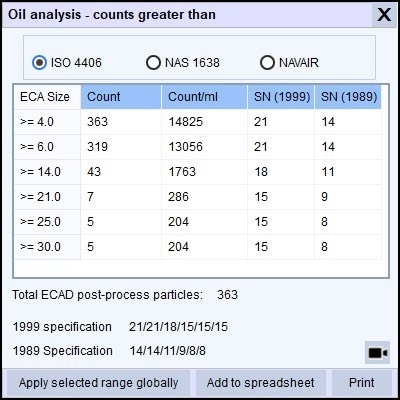
To show the results side-by side…….Image Credit: Vision Analytical Inc.
Comparisons and Observations
Some minor differences were observed, but there is a strong overall correlation. The reported total concentration of approximately 14,000 particles per ml was very close to that of many other size classes.
Advantages of the Raptor Over the APC
The Raptor can display the particles identified in each class with a single click. For instance, the thumbnails below show particles greater than 4 microns and greater than 25 microns.
A large air bubble was also found in this example. This can be safely ignored if it is an air bubble; the presence of a water droplet could highlight a different problem. Having access to this information in the field allows the user to identify the particles and make informed decisions at the point of testing.
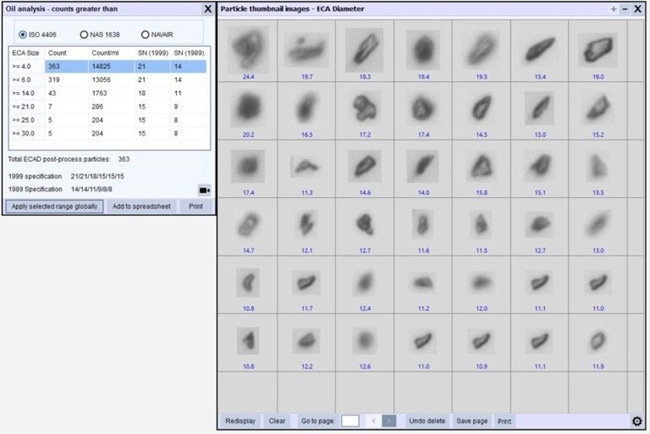
Image Credit: Vision Analytical Inc.
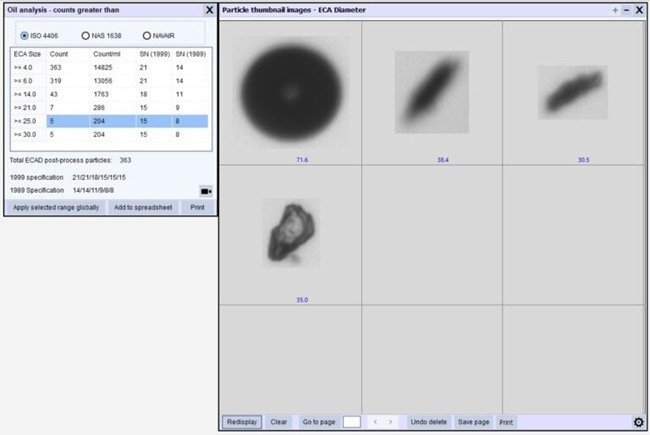
Image Credit: Vision Analytical Inc.
The Raptor is portable, so there is often no need to send samples back to the lab. Samples can be analyzed in the field, with images enabling users to make immediate decisions without relying on external experts.
ISO Alignment Without Compromise
ISO 21018-1 acknowledges that newer technologies cannot match the national calibration path of ISO 11171, but the Raptor system demonstrates that image-based technologies can deliver reliable, quantifiable data.
Every Raptor analysis produces:
- Size and shape metrics for every particle
- High-resolution thumbnails
- Classified results based on morphology, for example, flakes, fibers, spheres, or irregular particles
This combination of visual and morphological data offers capabilities that light obscuration alone cannot provide, making it indispensable for filter performance studies, root-cause analysis, and early failure detection.
Acknowledgments
Produced from materials originally authored by Vision Analytical Incorporated.

This information has been sourced, reviewed, and adapted from materials provided by Vision Analytical Inc.
For more information on this source, please visit Vision Analytical Inc.