Olive oil quality is influenced by multiple factors - from olive variety and processing conditions to storage and time-to-press after harvest. With premium products like virgin olive oil commanding high prices, ensuring authenticity and consistency is critical - not just for quality, but for adulteration prevention.
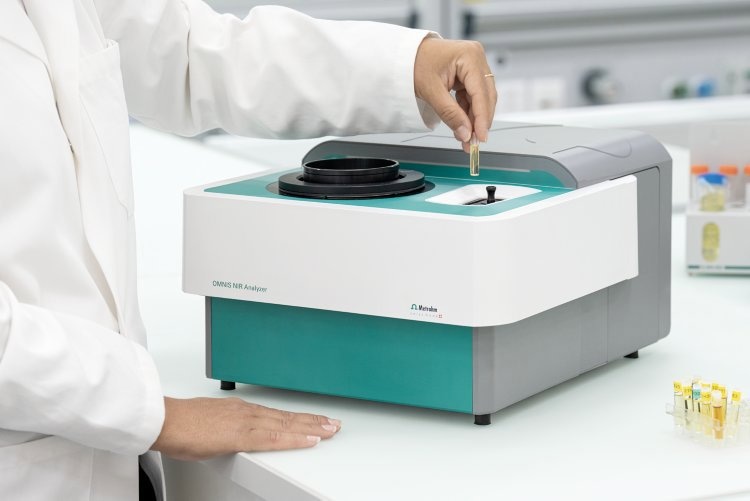
Image Credit: Metrohm Middle East
However, traditional testing methods such as gas chromatography and titration can be time-intensive, require hazardous solvents, and slow down routine quality control.
A faster approach to olive oil analysis
Near-infrared spectroscopy (NIRS) offers a rapid, non-destructive alternative for olive oil testing - delivering accurate results in seconds without the need for chemical reagents or complex sample preparation.
Using the OMNIS NIR Analyzer Liquid, samples can be measured directly in disposable vials under controlled conditions, enabling consistent and reproducible analysis across a wide range of oil types.
Comprehensive quality insights in a single measurement
NIRS enables simultaneous prediction of multiple key quality and authenticity parameters, including:
- Free fatty acids (FFA)
- Iodine value and refractive index
- Oxidation markers (peroxide value, K232, induction time)
- Fatty acid composition (e.g. oleic, linoleic, palmitic acids)
By combining Vis-NIR spectra with advanced calibration models, strong correlation with standard reference methods can be achieved - supporting reliable routine analysis.
Why it matters for producers and labs
For olive oil manufacturers and testing laboratories, this approach delivers:
- Significant time savings (results in seconds vs minutes or hours)
- No hazardous solvents or reagents
- Lower operational costs and reduced lab workload
- High-throughput screening for quality and authenticity
Read the Full App Note