The worldwide chocolate market was valued at approximately $131 billion in 2024. By 2023, this figure is expected to increase to roughly $173 billion, suggesting a steady growth rate of approximately 4 %.1 This growth level is underpinned by continued consumer demand and is expected to continue to increase.
Spectroscopy is increasingly used in chocolate manufacturing for quality control (QC) purposes, thanks to its ability to assess chocolate composition and provide a ‘fingerprint’ spectrum that reveals the sample’s chemical details. Specifically, Raman can be used in QC to differentiate between different types of chocolate, measure crystallization and texture, monitor the manufacturing process, and detect adulteration.
This article outlines techniques for collecting Raman spectra of various chocolates, providing a basis for adulteration detection and quality assessment.
Configuration
The i-Raman NxG 1064 is a high-performance Raman spectrometer purpose-built for the most complex and challenging sample types. Featuring a 1064 nm laser and a wide spectral range of 100–2500 cm-1 and a 1064 nm laser, it is very good at significantly reducing fluorescence interference, making it adept at analyzing brightly colored, highly fluorescent, and natural products, which can be problematic for traditional Raman systems.
This advanced capability enables the rapid, accurate measurement of challenging samples, often found in nutraceuticals, the petroleum sector, and pharmaceuticals. Its versatile setup, which enables transparent measurements through opaque containers, delivers high-quality results in challenging quality control processes where suppressing fluorescence is essential.
The i-Raman NxG 1064 is the ideal choice for users who require reliable, fluorescence-free Raman analysis of challenging quality control samples.
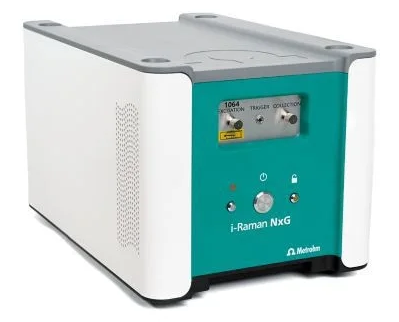
Image Credit: Metrohm Middle East FZC
Experimental Overview
Chocolate bars with different cocoa content, including white chocolate (Lindt, Switzerland), were measured using Raman spectra at a low laser power of 5 % and a long integration time of 120 seconds (Figure 1).
The specific chocolate sample types that were used are summarized in Table 1. The laser power was adjusted based on the chocolate’s cocoa content (ranging from white to 100%). If the laser power exceeded 15 %, this would result in molten chocolate.
Table 1. Samples and important Raman peaks. Source: Metrohm Middle East FZC
| Sample |
% Cocoa |
Chocolate
(various types) |
100 % |
| 85 % |
| 70 % |
| Milk (∼30 %) |
| White (20 %) |
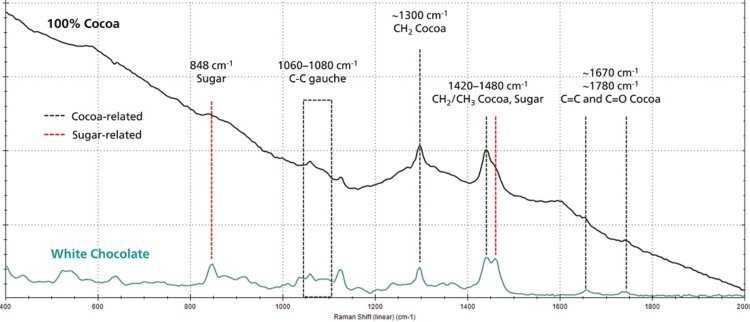
Figure 1. Representative Raman spectra of 100 % cocoa and white chocolate (no math treatment). Image Credit: Metrohm Middle East FZC
Table 2. List of important peaks shown in Figure 1.* Source: Metrohm Middle East FZC
| Relation |
Wavenumber (cm-1) |
| Cocoa-related |
1060–1080 |
| ∼1300 |
| 1420–1480 |
| ∼1670, ∼1780 |
| Sugar-related |
< 750, 848 |
| 1460 |
*See reference2 for more details on band assignments.
Method
Raman data collection, using an i-Raman NxG 1064 laboratory Raman system, (Figure 2) was optimized by adjusting laser power and integration time (Table 3) to determine the optimal conditions to minimize risk of sample melting and maximize signal strength.
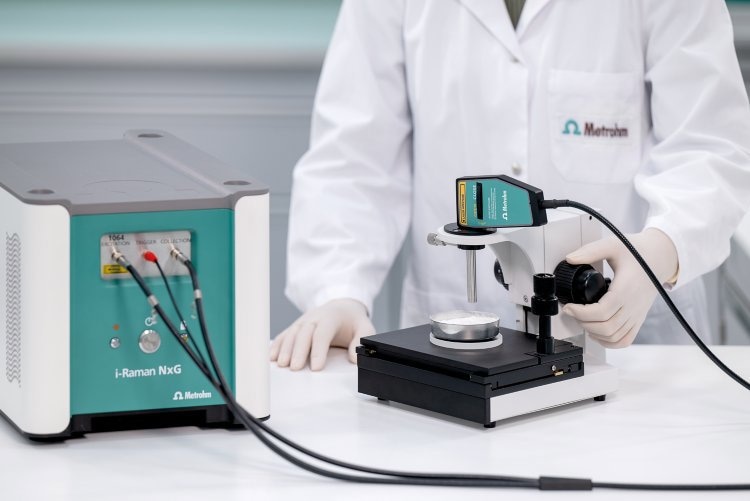
Figure 2. The i-Raman NxG 1064 and mounted fiber-optic probe from Metrohm were used in this study. Image Credit: Metrohm Middle East FZC
Table 3. System settings used for the analysis of different chocolate types by Raman spectroscopy. Source: Metrohm Middle East FZC
| |
|
| Excitation wavelength |
1064 nm |
| Laser power |
5–15 % |
| Integration time |
> 60 s |
| Accessories |
Standard Sampling Probe Probe Holder with distance regulator |
| Software |
SpecSuite |
All of the chocolate samples were analyzed by putting a piece of chocolate on the stage with a Raman probe securely locked above the sample (Figure 3). The probe’s z-axis position was adjusted while continuously monitoring the Raman signal’s intensity to determine the optimal working distance.
Once the optimal focal distance was determined, a distance regulator helped the operator position the probe on the sample to ensure reliable, consistent measurements.
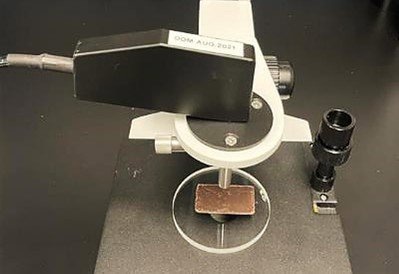
Figure 3. A chocolate sample on the probe holder. Image Credit: Metrohm Middle East FZC
Results
Laser Intensity and Melting
Chocolate melts between 30 and 36 °C. Due to its darker color, 100% chocolate was used to determine the laser-induced melting threshold. Darker samples absorb more laser light and, therefore, melt at shorter exposure times and lower powers.
Optimizing laser power is crucial to prevent thermal damage or structural changes during measurement. Raman spectra collected at 5 %, 10 %, and 15 % laser power displayed clear shifts in cocoa-related peaks (Figure 4a), with visible melting at 10 %. Lighter-colored chocolates tolerated higher levels of power, generally up to 15 %.
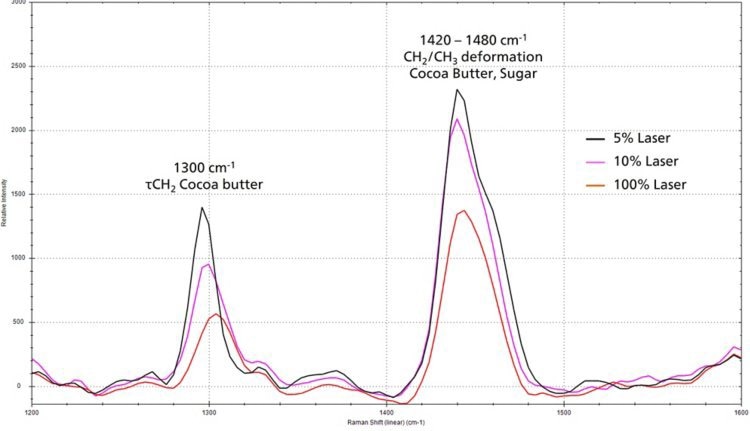
Figure 4a. Close-up view of Raman peaks from 100 % chocolate measured with 1064 nm laser at 5 %, 10 %, and 15 % laser power. Image Credit: Metrohm Middle East FZC
However, melting is not the only indicator of heat-induced structural changes. Even white chocolate showed subtle crystallinity shifts in the 1060–1100 cm-1 range when laser power exceeded 10 % (Figure 4b). These results emphasize that chocolate can thermally alter at relatively low laser powers, highlighting the need for careful power selection during quality control and quality assurance(QC/QA). Fluorescence rejection methods coupled with lower-power 785 nm excitation offer possible solutions.
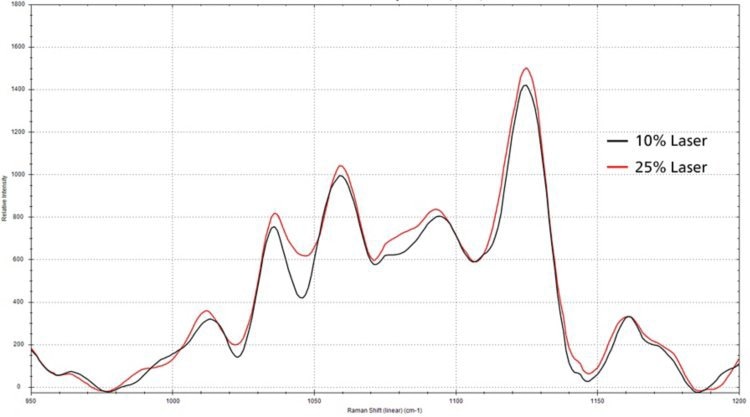
Figure 4b. White chocolate's gauche chain extension region measured with 10 % and 25 % laser power, demonstrating the difference between laser powers. Image Credit: Metrohm Middle East FZC
Raman Spectra of Test Samples
Chocolate is usually comprised of three primary components – cocoa butter, sugar, and cacao solids – in substantially different proportions, depending on the type of chocolate. For example, 100 % chocolate contains no added sugar, whereas white chocolate contains cocoa butter but no cacao solids. Other varieties lie somewhere between these two extremes, with different cocoa and sugar content (Table 4).
Table 4. Cocoa and sugar content of different chocolates. Source: Metrohm Middle East FZC
| Chocolate Type |
Cocoa (%)* |
Sugar (g)** |
| White |
20 |
16 |
| Milk |
31 |
17 |
| 70 % |
70 |
9 |
| 85 % |
85 |
4 |
| 100 % |
100 |
0 |
*Cocoa solid % based on the manufacturer3.
**Based on the total sugar content from nutrient tables.
The major sugar peaks are clearly observed in milk, white, and 70 % chocolates (Figure 5). However, in 85 % chocolate, the only visually evident sugar-related spectral feature appears at 1460 cm-1. This suggests that Raman effectively determines sugar content for QC measurements. Cocoa-related ingredients exhibit characteristic Raman bands at approximately 1300 cm-1 and 1420–1480 cm-1. Confining a Partial Least Squares (PLS) model to these spectral regions led to the most accurate predictive model for cocoa content analysis.
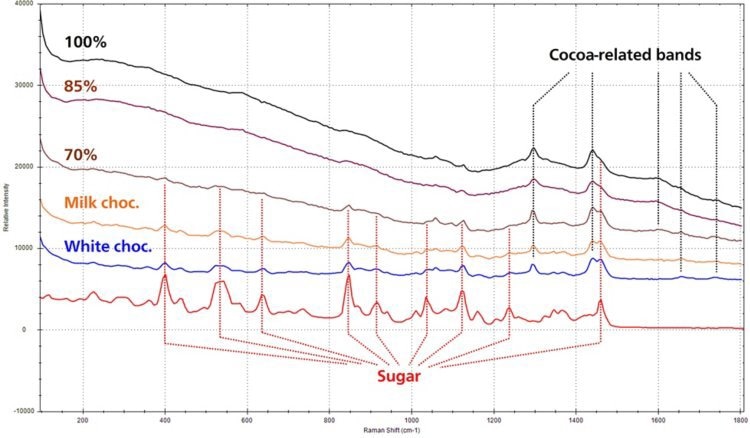
Figure 5. Raman spectra of 100 % cocoa, 85 % cocoa, 70 % cocoa, milk chocolate, white chocolate, and sugar. Data collection method: laser power 5 %, integration time 120 s, average 3. Image Credit: Metrohm Middle East FZC
PLS Model Performance and Predictive Accuracy
PLS models built from key peaks between 1200–1600 cm-1 in the Raman spectra of different types of chocolate demonstrate strong agreement between predicted and measured cocoa content, with low standard error. This validates that Raman spectroscopy is effective for routine cocoa content analysis (Figure 6a). Adding data points would improve confidence in predictions at higher cocoa levels.
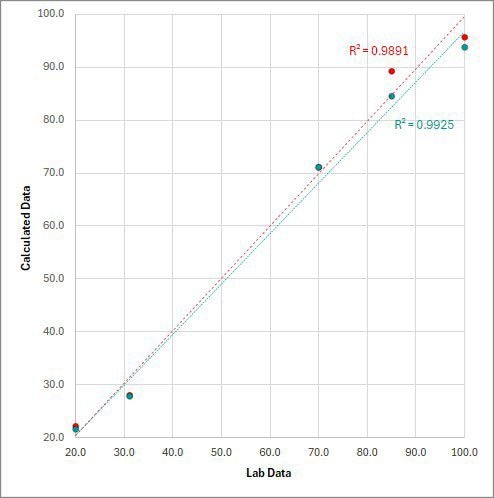
Figure 6a. PLS calibration model and model statistics of cacao solids and cocoa butter. Image Credit: Metrohm Middle East FZC
The sugar content model shows even better predictive accuracy, which is thought to be a result of distinct sugar peaks and the lack of temperature-related variation in sugar measurements. Sugar data may also refine predictions of cocoa-related content, as the Raman intensity of sugar varies proportionally with cocoa content (Figure 6b). Both cocoa and sugar contents are important QC parameters that can be measured using Raman spectroscopy.
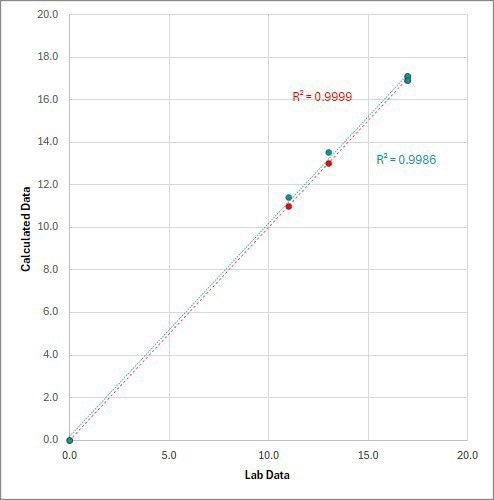
Figure 6b. PLS calibration model and model statistics of sugar content in different samples. Image Credit: Metrohm Middle East FZC
Conclusion
This article showcases Raman spectroscopy’s ability to perform rapid, non-destructive measurements of chocolate quality indicators. PLS models demonstrate high predictive accuracy for both sugar content and cocoa-related materials. Testing a wider range of chocolates and increasing the number of samples further improves the model’s accuracy and robustness.
Raman spectroscopy, when coupled with chemometric modeling, provides a reliable QC method for real-time routine chocolate analysis.
References
- marknteladvisors. Chocolate Market Size, Share, Analysis and Industry Trend to 2030.
- Esmonde-White, K., Lewis, M. and Lewis, I.R. (2022). Direct Measurement of Chocolate Components Using Dispersive Raman Spectroscopy at 1000 nm Excitation. Applied Spectroscopy, 77(3), pp.320–326. DOI: 10.1177/00037028221147941. https://journals.sagepub.com/doi/10.1177/00037028221147941.
- Lindt & Sprüngli AG . Lindt Schokolade seit 1845 | Lindt CH. (online) Available at: https://www.lindt.ch/de/.

This information has been sourced, reviewed and adapted from materials provided by Metrohm Middle East FZC.
For more information on this source, please visit Metrohm Middle East FZC.