Indium Tin Oxide (ITO) is a commonly used Transparent Conducting Oxide (TCO) material employed in the fabrication of solar cells, flat-panel displays, and touch-sensing technologies. These devices’ optoelectronic performance - most notably their good electrical conductivity and high optical transparency - is directly impacted by the sputtered ITO thin films’ microstructure.
Research shows that the grain density and orientation of the ceramic sputtering targets play a decisive role in sputtering efficiency, and are key to minimizing surface nodule formation on deposited films.1
The precursor ITO powder’s Particle Size Distribution (PSD) is a key factor governing target microstructure. PSD underpins both processing behavior and final product performance, impacting a number of essential properties.
Sintering Behavior
An optimized PSD minimizes residual porosity and promotes dense microstructure packing, which are key factors in reducing defect formation during sputtering.
Particle packing is considered ideal when fine particles effectively occupy the interstitial spaces between coarser particles, without adversely affecting the overall structural framework.2
Coarse particles are responsible for the primary mechanical integrity and skeletal structure of the pressed target, while fine particles function as a ‘mortar,’ reducing shrinkage porosity during the Hot Isostatic Pressing (HIP) phase and filling voids between larger particles.3
Electrical Conductivity
Efficient particle packing is key to lowering grain boundary density, and, as a result, reducing electrical resistivity and improving the sintered target’s conductivity.2
Phase Homogeneity
A well-balanced PSD supports uniform diffusion of tin ions (Sn4+) into the indium oxide lattice, contributing to stable electrical properties and consistent phase composition.
The accurate PSD characterization of high-density ITO powders continues to be analytically challenging despite its importance. This is due to their particle agglomeration, high refractive index, and broad size range.
This article evaluates the Bettersizer 2600 Plus laser diffraction analyzer as a high-fidelity, high-resolution solution for characterizing ITO powder PSD, enabling enhanced sintering performance, optimized packing efficiency, and improved quality control of upstream ceramic precursors.
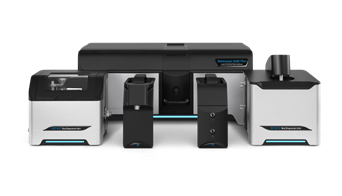
Image Credit: Bettersize Instruments
Experimental Design
The Bettersizer 2600 Plus was used to perform particle size measurements in order to differentiate between suboptimal powder batches and ‘application-ready’ ITO grades.
This study was conducted under controlled and reproducible conditions, with both dry and wet dispersion modules employed to evaluate dispersion behavior across different material types and verify the measurement methodology’s robustness and consistency.
Wet dispersion was used for all ITO samples to ensure stable particle suspension and effective deagglomeration during analysis. Both wet and dry dispersion approaches were also applied to SnO2 samples to evaluate the versatility of the method and compare dispersion efficiency between different measurement modes.
Table 1 outlines detailed measurement procedures and operating parameters for each ITO powder sample type, while Table 2 summarizes procedures and parameters for SnO2 powders.
Table 1. Measurement Procedure for ITO Samples (Case 1, Wet Dispersion). Source: Bettersize Instruments
| Procedure Step |
Parameter |
Value/Condition |
| Sample Preparation |
Sample amount |
1 - 3 g |
| Pre-test treatment |
Pre-dispersion in selected dispersion medium. |
| Dispersion |
Dispersion medium |
DI water |
| Circulation speed |
1200 rpm |
| Ultrasonication |
35 W power, measurements performed with continuous ultrasonication |
| Measurement |
Optical model |
Mie |
| Particle refractive index (RI) |
1.82 |
| Particle absorption rate (AR) |
0.1 |
| Medium RI |
1.333 |
| Target obscuration range |
10 % - 20 % |
| Measurement repetitions |
6 repetitions |
Table 2. Measurement Procedure for SnO2 Samples (Case 2, Wet and Dry Dispersion). Source: Bettersize Instruments
| Procedure Step |
Parameter |
Value/Condition |
| Sample Preparation |
Sample amount |
1 - 3 g |
| Pre-test treatment |
Pre-dispersion in selected dispersion medium (wet) / Sample added directly to the funnel of BT-912 using a spoon. (dry) |
| Dispersion (Wet) |
Dispersion medium |
Deionized (DI) water |
| Circulation speed |
1200 rpm |
| Ultrasonication |
No ultrasonication dispersion |
| Dispersion (Dry) |
Dispersion medium |
Air |
| Feeding rate |
11 |
| Feeding height |
2.1 mm |
| Dispersion pressure |
0.05 MPa |
| Measurement |
Optical model |
Mie |
| Particle refractive index (RI) |
1.512 |
| Particle absorption rate (AR) |
0.5 |
| Medium RI |
1 |
| Target obscuration range |
8 % - 15 % (wet) / 5 - 10 % (dry) |
| Measurement repetitions |
6 repetitions |
Case Study 1: Comparative Analysis of Packing Efficiency (ITO)
Two sulfide-derived ITO powder samples were evaluated to assess their suitability for fabricating high-density sputtering targets. These samples were acquired from the same supplier but processed using different milling routes.
The powders originate from identical raw materials, but their differing milling histories resulted in notably different particle size distribution (PSD) profiles.
High-resolution particle size analysis using the Bettersizer 2600 Plus (Figure 1) reveals distinct structural characteristics that would be impossible to adequately describe using traditional summary statistics alone.
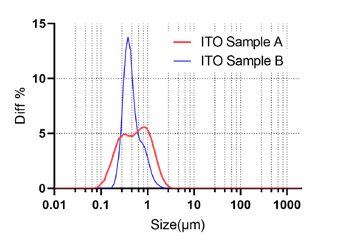
Figure 1. Particle Size Distribution Curve of ITO Sample A vs Sample B. Image Credit: Bettersize Instruments
Table 3. Key Particle Size Values of ITO Sample A vs Sample B. Source: Bettersize Instruments
| |
D10 (μm) |
D50 (μm) |
| Sample A |
0.266 |
0.396 |
| Sample B |
0.184 |
0.508 |
Sample A: Optimized for High Density
Sample A shows a distinct bimodal particle size distribution that is characterized by a pronounced separation between coarse and fine particle populations.
The Furnas packing model dictates that this bimodal PSD profile is ideally suited to ceramic sintering applications. The fine particles in this instance would fill the interstitial voids formed between the coarse particle structural skeleton.3
This ‘binary-size’ packing arrangement maximizes the green body density, minimizes tortuous pathways for electron transport, and reduces residual porosity after sintering. All of these factors help to improve electrical performance in the final ITO target.
Sample B: Detection of Suboptimal Packing
Sample B would appear to feature more fine particles based on its lower D10 value, but its higher D50 and D90 values, and broader PSD reflect a shouldered distribution as opposed to a true bimodal profile.
Effective void filling is limited by the absence of a distinct separation between particle populations. Particles within the intermediate size range of the ‘shoulder’ region will typically hinder close packing by propping open gaps between larger particles as opposed to filling the interstitial spaces.
This inefficient packing mechanism is linked to increased residual porosity following sintering, which has, in turn, been correlated with reduced target performance and higher electrical resistivity in sputtering applications.4
Repeatability Evaluation
Each ITO sample was analyzed six times under identical experimental conditions to verify the system’s measurement stability and reproducibility. The Relative Standard Deviation (RSD) was calculated for key particle size percentiles (D10, D50) to quantitatively assess measurement consistency.
Table 4. Repeatability (%RSD) Across Six Runs. Source: Bettersize Instruments
| |
%RSD D10 |
%RSD D50 |
| Sample A |
0.20 |
0.37 |
| Sample B |
0.28 |
0.98 |
The system delivered excellent repeatability across all measured percentiles, with %RSD values found to be considerably below the performance criteria defined in ISO 13320.6
These results showcase the Bettersizer 2600 Plus’s high measurement stability, confirming its suitability for comprehensive particle size characterization, even when working under strict quality assurance and process control requirements.
Case Study 2: Upstream Quality Control (SnO2)
Raw Tin Oxide (SnO2) precursor powders were assessed using both wet and dry dispersion techniques to minimize downstream processing risks and ensure supply-chain robustness.
This study aimed to validate a rapid, high-throughput dry dispersion method suitable for routine incoming quality control, while simultaneously ensuring equivalence with established wet dispersion measurements.
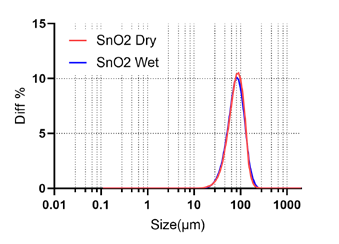
Figure 2. Particle size distribution curve of SnO2 wet method vs dry method. Image Credit: Bettersize Instruments
The PSD obtained using dry dispersion (red curve) closely matches that measured by the wet dispersion method (blue curve) across the entire dynamic range (Figure 2).
It can be observed that the primary distribution peaks are closely aligned, and the overall distribution widths (span values) are almost identical.
This strong agreement verifies that pneumatic shear forces generated by the dry dispersion system’s Venturi nozzle are sufficient to overcome the Van der Waals forces responsible for agglomeration in SnO2 powder.
It is, therefore, possible to achieve a dispersion state equivalent to the dispersion state achieved through the liquid-based agitation method.
Table 5. Cross-Method Reliability. Source: Bettersize Instruments
| |
D10 (μm) |
D50 (μm) |
| Wet method |
43.10 |
76.53 |
| Dry method |
43.82 |
77.72 |
| Relative Differences* % |
1.67 |
1.55 |
*Relative differences calculated with respect to wet-method results.
These results show excellent correlation between the two dispersion methods, exhibiting relative differences of less than 3 % for all the key particles’ reported percentiles.
This level of agreement confirms that the dry dispersion method is a dependable option for routine quality control measurements. Quality control laboratories can considerably increase throughput and operational efficiency by adopting dry dispersion for incoming inspection, while also maintaining data integrity.
Notably, employing this approach ensures that manufacturers are able to identify substandard precursor batches prior to them entering the expensive compounding and solid-state diffusion stages. This is key to preventing defects and reducing waste in downstream ITO target production.5
Repeatability Evaluation
SnO2 samples were analyzed six consecutive times to assess the stability and reproducibility of the measurement system. This was performed using both wet and dry dispersion methods.
Measurement repeatability was quantified by calculating the Relative Standard Deviation (RSD) for each key particle size percentile (D10, D50).
Table 6. SnO2 Repeatability Statistics. Source: Bettersize Instruments
| |
%RSD D10 |
%RSD D50 |
| Wet method |
0.14 |
0.07 |
| Dry method |
1.00 |
0.10 |
The results demonstrate both dispersion methods’ excellent repeatability. All RSD values are considerably below the ISO 13320 requirements,6 confirming that the Bettersizer 2600 Plus offers the measurement stability and data integrity required for strict process control and quality assurance applications.
Conclusion
Rigorous, high-fidelity characterization of raw powder microstructures is required to ensure the successful fabrication of high-performance sputtering targets. The integration of the Bettersizer 2600 Plus into research and quality control workflows offers users a comprehensive analytical solution able to facilitate informed decision-making across the production chain.
Firstly, the system offers in-depth insight into powder structure, accurately distinguishing shouldered distributions that compromise packing efficiency from engineered bimodal ITO grades that have been optimized for high-density sintering.
The achieved level of detail highlights key structural deficiencies that conventional single-value metrics such as D50 cannot detect alone.
Secondly, the system’s ability to significantly improve operational efficiency in upstream quality control is highlighted by evaluating a high-throughput dry dispersion method for SnO2 precursors. This approach enables the rapid screening of materials, reducing processing time and cost while improving supply chain robustness.
Finally, the instrument also delivers highly repeatable PSD measurements, achieving RSD values considerably below 0.2 % for key percentiles. This degree of repeatability reduces variability during sintering, supports reliable batch-to-batch consistency, and minimizes yield loss in furnace operations.
This combination of powerful capabilities establishes the Bettersizer 2600 Plus as an ideal tool for ensuring process stability, optimizing material selection, and delivering consistent performance in sputtering target manufacturing.
References and Further Reading
- Mei, F., et al. (2018). Microstructure evolution and grain orientation in ITO targets and their effects on the film characteristics. Journal of Materials Science: Materials in Electronics, 29(17), pp.14620–14634. DOI: 10.1007/s10854-018-9598-7. https://link.springer.com/article/10.1007/s10854-018-9598-7.
- Zhai, X., et al. (2020). A new strategy of binary-size particles model for fabricating fine grain, high density and low resistivity ITO target. Ceramics International, [online] 46(9), pp.13660–13668. DOI: 10.1016/j.ceramint.2020.02.152. https://www.sciencedirect.com/science/article/abs/pii/S0272884220304788?via%3Dihub.
- Helle, A.S., Easterling, K.E. and Ashby, M.F. (1985). Hot-isostatic pressing diagrams: New developments. Acta Metallurgica, 33(12), pp.2163–2174. DOI: 10.1016/0001-6160(85)90177-4. https://www.sciencedirect.com/science/article/abs/pii/0001616085901774.
- Liu, T., et al. (2022). Effect of particle composition on microstructure and resistivity of indium tin oxide targets. Chemical Physics Letters, (online) 801, p.139743. DOI: 10.1016/j.cplett.2022.139743. https://www.sciencedirect.com/science/article/abs/pii/S0009261422004109.
- N Nadaud, et al. (1998). Structural Studies of Tin-Doped Indium Oxide (ITO) and In4Sn3O12. Journal of Solid State Chemistry, 135(1), pp.140–148. DOI: 10.1006/jssc.1997.7613. https://www.sciencedirect.com/science/article/abs/pii/S0022459697976131?via%3Dihub.
- ISO (2020). Particle size analysis – Laser diffraction methods, ISO 13320:2020, International Organization for Standardization. (online) ISO. Available at: https://www.iso.org/standard/69111.html.
Acknowledgments
Produced from materials originally authored by Wenchen Gan from Bettersize Technologies.

This information has been sourced, reviewed and adapted from materials provided by Bettersize Instruments.
For more information on this source, please visit Bettersize Instruments.