Metal powders’ characteristics play a pivotal role in final product quality and consistency in additive manufacturing, particularly powder bed fusion. This article explores the relationships between particle size distribution, particle shape, bulk density, and flowability of the metal powders employed in three-dimensional (3D) printing.
Three-dimensional printing has emerged as a critical technology in the Industry 4.0 era, undergoing rapid developments that conventional powder manufacturing processes are no longer able to accommodate.
To ensure the high performance and consistency of printed components, metal powders for 3D printing require more stringent control over parameters such as bulk density, particle size, particle shape, and fluidity versus other powder materials.
The quality of these metal powders directly impacts the manufacturing process and the performance of the finished part.
Impact of Particle Size and Distribution
The layer-by-layer stacking process is a unique mode for manufacturing 3D-printed parts in powder-bed fusion additive manufacturing, meaning that the thickness of the powder layer is a key factor impacting final product performance.
Typical powder size ranges for laser powder bed fusion (LPBF) range from 10 to 50 µm, supporting high-precision printing. Smaller powder particle size generally results in a thinner powder layer and increased densification of the formed part (Figure 1).1,2
Fine particles are prone to agglomeration, however, potentially leading to reduced fluidity and powder bed density. A wider particle size distribution (PSD) improves packing density by allowing smaller particles to fill the voids between larger particles, but this also risks reducing flowability.
Optimal particle size and PSD are, therefore, key to enhancing powder bed packing and flowability.
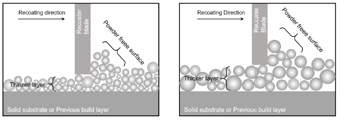
Figure 1. Schematic of AM powder spreading process with a recoater blade. Image Credit: Bettersize Instruments
Impact of Particle Shape
Particle sphericity has a major impact on 3D printing performance. Powders used in 3D printing should exhibit a high degree of sphericity to promote good flow and ensure uniformity at higher layer densities.
Irregular powder particles impede flowability, however, resulting in increased voids and gaps in the powder bed (Figure 2).
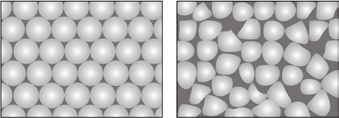
Figure 2. Packing of regular (spherical) and irregular particles. Image Credit: Bettersize Instruments
Impact of Powder Bulk Density and Flowability
Powder bulk density and flowability are key parameters that impact both the density of the molded part and the packing density of the printed layer.
PSD significantly influences bulk packing density by determining void filling efficiency. An optimal PSD will enhance packing density by ensuring maximum interparticle contact and minimal voids.
A sub-optimal PSD can lead to reduced density and significant void formation due to the entrapment of fine particles in the gaps between coarse particles. This leads to the presence of a wedging effect.3
Higher powder bulk density correlates with greater density in the resulting part during the molding process (Figure 2), while low packing density results in porosity and rough surface deformation.4
Good flowability is key to ensuring uniform powder spreading during the printing process, preventing uneven layering and build-up while enhancing the part’s dimensional accuracy and surface finish.
Optimizing both powder bulk density and flowability is, therefore, essential if the quality and efficiency of 3D printing is to be ensured.
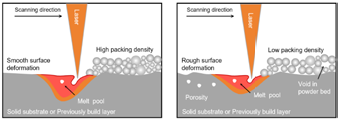
Figure 3. Schematic illustration of the Laser Powder Bed Fusion (LPBF) process with high and low powder bed density. Image Credit: Bettersize Instruments
This article features a comprehensive investigation of the powder and particle properties of four alloy metal powders. A widely recognized laser diffraction method is used to measure particle size distribution, while dynamic imaging is used to assess particle shape. These evaluations were performed using the Bettersizer 2600 Plus, along with assessments of bulk density and flowability.
The findings highlight the importance of ensuring optimal particle size distribution and particle shape when optimizing powder bed flowability and packing density. This, in turn, impacts printing process stability and the reliability of the resulting parts.
The study presented here offers valuable insights for analyzing the physical properties of powders used in 3D printing by looking at how microscopic particle characteristics affect macroscopic powder properties.
Experimental Procedures
The Bettersizer 2600 Plus laser diffraction particle size analyzer was used to measure the particle size distribution of powder particles. The principle of laser diffraction depends on the ability of detectors to capture individual particles’ scattering patterns when the laser beam strikes the particles in the sample cell (Figure 4). Scattered light signals are converted into particle size distribution information using Mie scattering theory.
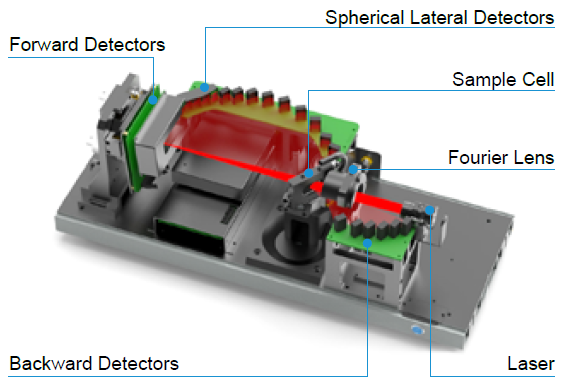
Figure 4. Setup of the Bettersizer 2600 Plus laser system. Image Credit: Bettersize Instruments
The Bettersizer 2600 Plus’s PIC-1 module is used to characterize particle shape via dynamic imaging. This method uses two LED lights to illuminate dispersed particles as the sample flows through the sample cell (Figure 5). Two cameras capture clear images of each particle, one offering 0.5x magnification and the other offering 10x magnification.
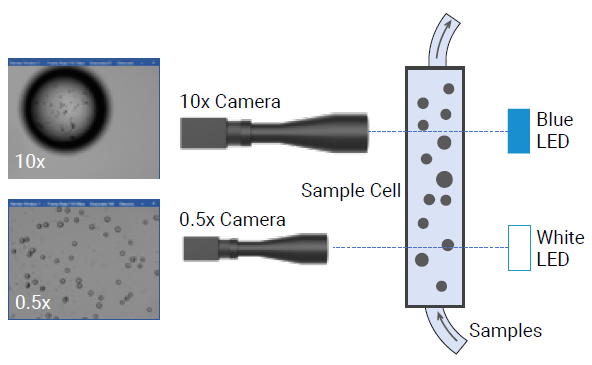
Figure 5. Setup of the PIC-1 dynamic imaging system of Bettersizer 2600 Plus. Image Credit: Bettersize Instruments
Metal powders’ flow rate and bulk density are measured using an HFlow 1 flowmeter funnel in line with the ASTM B212 and ASTM B213 standards.
It is possible to set up the HFlow 1 with Hall (2.5 mm orifice), Gustavsson (2.5 mm orifice), and Carney (5 mm orifice) funnels. Flowability in this instance is determined by measuring the time taken for 50 g of powder to pass through a Hall funnel.
Bulk density is evaluated by measuring the density of powder that naturally falls through the same Hall funnel into a 25 ml measuring cup (Figure 6).
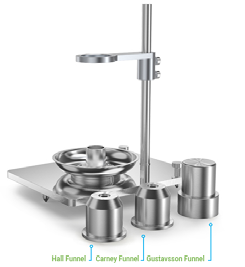
Figure 6. Setup of HFlow 1 with Hall, Carney and Gustavsson funnels. Image Credit: Bettersize Instruments
Results and Discussion
Particle Size and Distribution
Figure 7 and Table 1 present the results of the particle size analysis. The D50 values for samples #1 to #4 were determined to be 42.62 µm, 37.75 µm, 37.57 µm, and 34.68 µm, respectively.
It was observed that samples #2 and #3 exhibited similar D50 values, demonstrating that each possessed comparable particle sizes. Sample #1 features a relatively larger particle size, indicating coarser characteristics, while sample #4 indicates the smallest particle size, implying finer particles.
Span values are also calculated using the equation: Span=(D90-D10)/D50).
The values confirm that sample #2 features a narrower particle size distribution versus the other three samples.
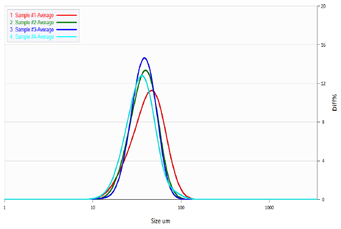
Figure 7. Particle size distribution of 4 samples. Image Credit: Bettersize Instruments
Table 1. Results of particle size measurement. Source: Bettersize Instruments
| Powder Name |
D10 (μm) |
D50 (μm) |
D90 (μm) |
Span |
| Sample #1 |
22.95 |
42.62 |
70.59 |
1.093 |
| Sample #2 |
23.15 |
37.75 |
57.90 |
0.925 |
| Sample #3 |
24.51 |
37.57 |
56.21 |
0.917 |
| Sample #4 |
20.92 |
34.68 |
55.78 |
1.008 |
Particle Shape
A Bettersizer 2600 Plus fitted with both the PIC-1 and BT-812 models was used to measure over 20,000 particles from each sample over time. Figure 8 features images of individual particles acquired from the four test powders. These images were captured during shape evaluation.
Table 2 details the circularity (C) of all samples. The Bettersize software automatically calculates circularity using the equation.
Here, A is the projected area of a particle while P is the perimeter of the projected area. This metric offers a useful measure of the particle’s similarity to a sphere, with a value of 1 signaling a perfect circle.
The value Cx represents particles’ circularity at x% accumulation. Sample #3 exhibits poorer circularity, while the other three samples exhibit similar circularity values (Table 2).
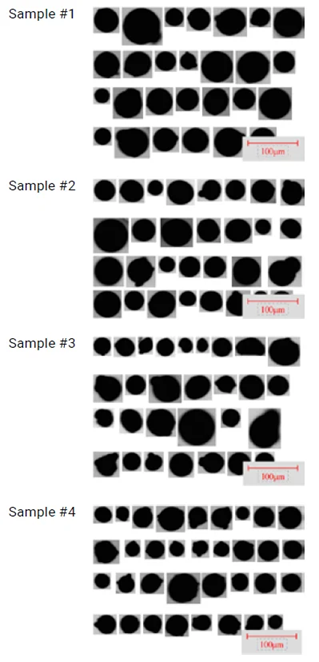
Figure 8. Particle images from PIC-1. Image Credit: Bettersize Instruments
Table 2. Circularity evaluation of four samples. Source: Bettersize Instruments
| Powder Name |
Number of Detected Particles |
C10 |
C50 |
C90 |
| Sample #1 |
21357 |
0.874 |
0.935 |
0.957 |
| Sample #2 |
23985 |
0.886 |
0.938 |
0.956 |
| Sample #3 |
23063 |
0.867 |
0.928 |
0.918 |
| Sample #4 |
27105 |
0.870 |
0.932 |
0.960 |
Flowability and Bulk Density
Table 3 illustrates the relationship between the four samples’ particle shape, particle size, bulk density, and flowability characteristics.
Samples #1 and #2 exhibit similar sphericity. Bulk density and flowability also decline as particle size decreases.
Samples #2 and #3 are shown to exhibit similar particle size, though sample #3's poorer sphericity results in lower packing density because of particle filling and bridging. Its flowability also decreases because of increased interparticle friction.
It can, therefore, be concluded that powders’ packing properties and flowability are impacted by both particle size and shape. It is important to investigate particle size distribution, particle shape, bulk density, and flowability to better understand these relationships and maintain feedstock quality.
Table 3. Summary of particle size, particle shape, bulk density and flowability. Source: Bettersize Instruments
Powder
Name |
D50
(μm) |
C50 |
Bulk density
(kg/cm3) |
Flow rate
(s/50 g) |
| Sample #1 |
42.62 |
0.935 |
4.22 |
21.2 |
| Sample #2 |
37.75 |
0.938 |
4.13 |
22.3 |
| Sample #3 |
37.57 |
0.928 |
4.02 |
25.8 |
| Sample #4 |
34.68 |
0.932 |
4.05 |
26.1 |
Conclusion
The study presented here underscores metal powder characteristics’ essential role in additive manufacturing, most notably how the optimization of particle size distribution, particle shape, flowability, and bulk density is key to achieving superior quality in 3D printed powders.
Laser diffraction and dynamic imaging using the Bettersizer 2600 Plus, used in conjunction with the HFlow-1 funnel flowmeter, offer a robust foundation for improving powder properties and increasing the capabilities of 3D printing technology.
Acknowledgments
Produced from materials originally authored by Perfil Liu from Bettersize Technologies.
References and Further Reading
- Abd-Elghany, K. and Bourell, D.L. (2012). Property evaluation of 304L stainless steel fabricated by selective laser melting. Rapid Prototyping Journal, 18(5), pp.420–428. DOI: 10.1108/13552541211250418. https://www.emerald.com/rpj/article-abstract/18/5/420/363529/Property-evaluation-of-304L-stainless-steel?redirectedFrom=fulltext.
- Duncan William Gibbons, Govender, P. and Der, V. (2023). Metal powder feedstock evaluation and management for powder bed fusion: a review of literature, standards, and practical guidelines. Progress in Additive Manufacturing. DOI: 10.1007/s40964-023-00484-x. https://link.springer.com/article/10.1007/s40964-023-00484-x.
- Panwisawas, C., Tang, Y.T. and Reed, R.C. (2020). Metal 3D printing as a disruptive technology for superalloys. Nature Communications, 11(1). DOI: 10.1038/s41467-020-16188-7. https://www.nature.com/articles/s41467-020-16188-7.
- Kwan, A.K.H., Chan, K.W. and Wong, V. (2013). A 3-parameter particle packing model incorporating the wedging effect. Powder Technology, 237, pp.172–179. DOI: 10.1016/j.powtec.2013.01.043. https://www.sciencedirect.com/science/article/abs/pii/S0032591013000715.

This information has been sourced, reviewed and adapted from materials provided by Bettersize Instruments.
For more information on this source, please visit Bettersize Instruments.