The global demand for precious metals has surged due to significant economic expansion. Chalcopyrite (CuFeS2) now serves as the world's preeminent copper ore.

Image Credit: Dan Olsen/Shutterstock.com
The extraction process for copper (Cu) involves concentrating the ore through flotation and smelting. The resultant waste material, known as slag, is separated and often contains substantial quantities of precious metals. Therefore, copper ore, slags, and copper concentrates can be analyzed to assess their potential as sources of these valuable elements.
Inductively coupled plasma optical emission spectrometry (ICP-OES) has become a favored technique for the analysis of trace elements in diverse matrices, including metal and metal ore samples, owing to its exceptional sensitivity, robustness, and multi-element analytical capabilities.
However, despite ICP-OES's unique advantages, the precise determination of precious metals is severely impeded by the emission spectra of matrix components. Specifically, ICP-OES instruments with relatively low spectral resolution (Δλ = 10–20 pm) are susceptible to spectral interferences originating from line-rich matrices.
This often requires complex calibration strategies or the selection of alternative emission lines with reduced sensitivity. Copper ores and intermediate products commonly contain, in addition to copper, significant amounts of iron (Fe), cobalt (Co), and other transition metals.
It is well-established that iron is an element emitting an extremely dense spectrum, with over 9300 ICP spectral lines between 200 and 400 nm, while copper exhibits more than 1400 lines. Unfortunately, these lines frequently overlap with the most prominent and sensitive emission lines of precious metals.
The following report details the application advantages for trace element determination in copper and copper ore materials, specifically highlighting benefits derived from the use of the PlasmaQuant 9200 Elite.
The optical system of this ICP-OES instrument enables high resolution (2 pm @ 200 nm) and features output sections covering the UV and visible wavelength ranges (from 160–900 nm) without spectral gaps.
With access to over 40,000 emission lines, the system facilitates the selection of alternative, interference-free lines with sufficient sensitivity for all analyzed elements. Furthermore, application benefits that arise from the integration of powerful software tools (ABC, CSI) for background correction and the removal of spectral interferences are presented.
Materials and Methods
Sample Preparation
All laboratory equipment was cleaned with deionized (DI) water from a PURELAB system (18.2 MΩ-cm, ELGA LabWater, High Wycombe, England). The chemicals used were of analytical reagent grade.
All multi-element stock solutions were prepared using single-element and multi-element standard solutions (Merck, Sigma-Aldrich). Working standards were matrix-matched and prepared by serial volume/volume dilution in polypropylene tubes from the stock solutions, employing an acidic mixture of 5 % (v/v) nitric acid (HNO3) and 15 % (v/v) hydrochloric acid (HCl).
The samples encompassed a wide range, from various ores (copper ore, cobalt copper ore) to intermediate materials (e.g., black copper, copper concentrate, blister copper from the refining process), culminating in the final product, known as cathode copper.
Approximately 0.5 g of each sample was precisely weighed (to 0.0001 mg) into a digestion vessel (DAP60). Subsequently, 2 (± 0.1) mL of HNO3 and 7.5 (± 0.1) mL of HCl were added.
The mixture was carefully swirled and allowed to stand for at least 15 minutes before the vessel was sealed. Subsequent heating was performed in stages (175 °C for five minutes, 190 °C for five minutes, 200 °C for 20 minutes) within a speedwave XPERT microwave digestion system.
Afterward, the vessels were allowed to cool to room temperature to prevent foaming and splashing. The solutions were transferred to a graduated polypropylene tube, diluted to 50 mL with DI water, and centrifuged (1125xg, 10 minutes). The supernatants were directly submitted for analysis.
Calibration
Calibration levels for each element were selected based on their anticipated concentration ranges. A minimum of four calibration standards were used for each element, as detailed in Table 1.
Selected calibration curves are illustrated in Figure 1. Nickel (Ni) was analyzed in both axial and radial views, resulting in improved precision for trace and minor concentrations of the element within the same method.
Table 1. Concentration of calibration standards. Source: Analytik Jena
| Element |
Unit |
Cal. 0 |
Std. 1 |
Std. 2 |
Std. 3 |
Std. 4 |
Std. 5 |
Std. 6 |
Std. 7 |
Std. 8 |
| Ag, Niaxial |
mg/L |
0 |
0.05 |
0.1 |
0.2 |
0.5 |
1.0 |
- |
- |
- |
Au, Ge, In, Ir,
Pd, Pt, Ru, Rh |
mg/L |
0 |
0.05 |
0.1 |
0.2 |
0.5 |
- |
- |
- |
- |
| Niradial |
mg/L |
0 |
- |
- |
- |
- |
1.0 |
5.0 |
10 |
20 |
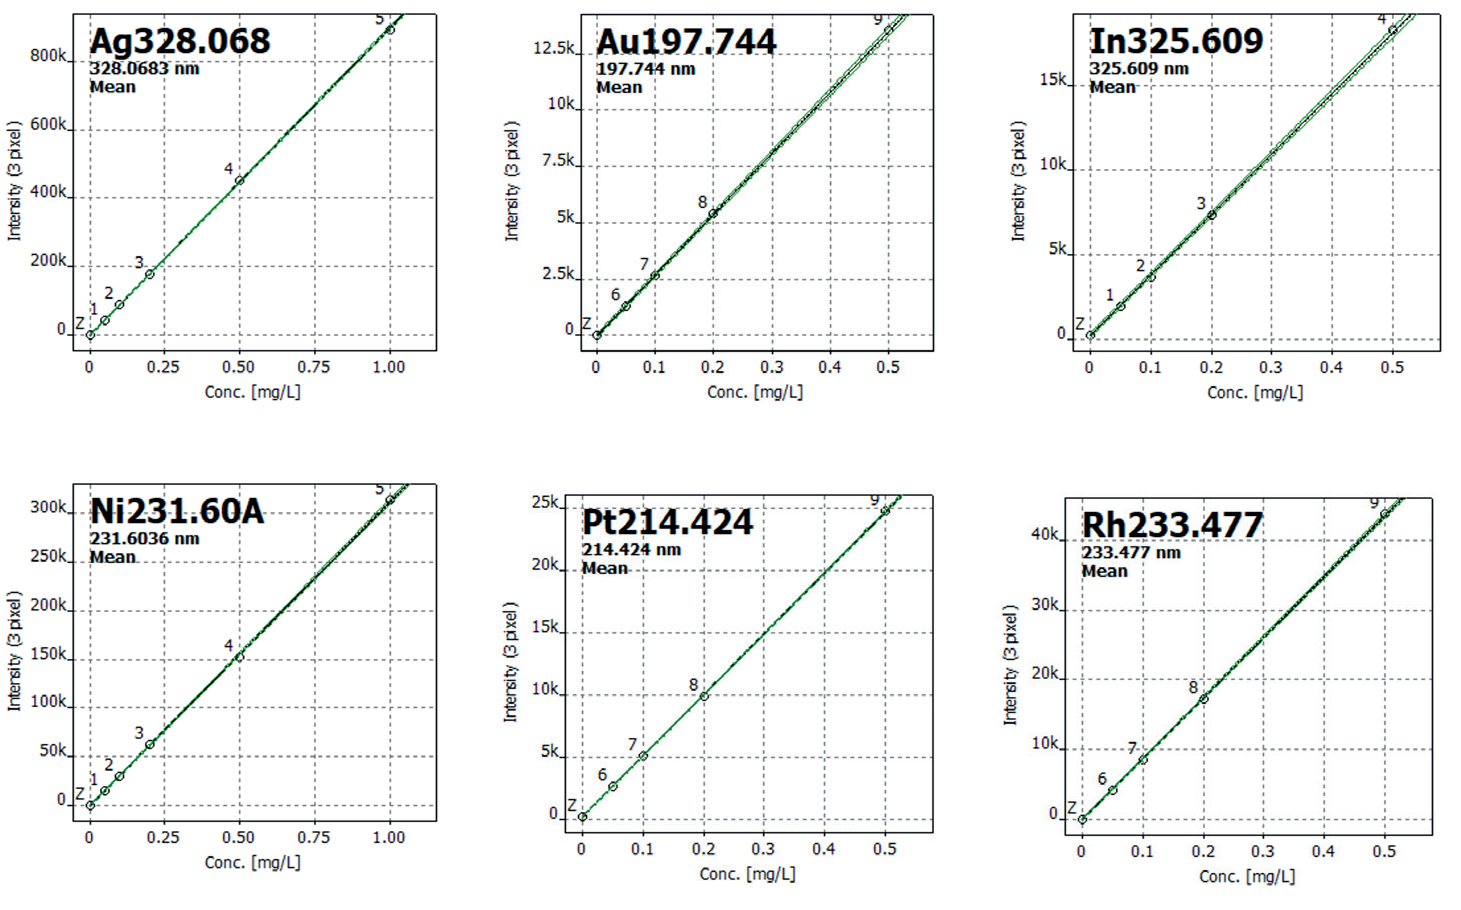
Figure 1. Selected calibration curves. Image Credit: Analytik Jena
Instrument Settings
The analysis was conducted on a PlasmaQuant 9200 Elite ICP-OES. The sample introduction components and instrumental parameters were optimized to achieve high sensitivity for trace elements in complex matrix samples.
A Teledyne CETAC ASX-560 autosampler was employed in conjunction with this instrument. Argon served as the internal standard.
Table 2 presents a summary of individual settings and components.
Table 2. Instrument settings. Source: Analytik Jena
| Parameter |
Specifications |
| Plasma power |
1350 W |
| Plasma gas flow |
9 L/min |
| Auxiliary gas flow |
0.5 L/min |
| Nebulizer gas flow |
0.6 L/min |
| Nebulizer |
Concentric nebulizer for high salt content, 2.0 mL/min, borosilicate |
| Spray chamber |
Cyclonic spray chamber with dip tube, 50 mL, borosilicate |
| Outer tube/Inner tube |
Quartz/Quartz |
| Injector |
Quartz, ID: 2 mm |
| Sample tubing |
PVC (black/black) |
| Pump rate |
1.00 mL/min |
| Fast pump |
4.00 mL/min |
| Measuring delay/Rinse time |
55 s/25 s |
| Torch position |
0 mm |
Method and Evaluation Parameters
Table 3. Method parameters. Source: Analytik Jena
| Element |
Line
[nm] |
Plasma
view |
Integration |
Read
time [s] |
Evaluation |
| Pixel |
Baseline fit |
Correction |
| Ar |
420.068 |
axial/radial |
Peak |
1 |
3 |
ABC1 |
- |
| Ag |
328.068 |
axial |
Peak |
1 |
3 |
ABC |
Ar2 |
| Au |
197.744 |
axial |
Peak |
3 |
3 |
ABC |
Ar |
| Ge |
265.117 |
axial |
Peak |
3 |
3 |
static |
Ar |
| In |
325.609 |
axial |
Peak |
3 |
1 |
ABC |
Ar |
| Ir |
215.268 |
axial |
Peak |
3 |
3 |
static |
Ar |
| Ni |
231.648 |
axial |
Peak |
1 |
3 |
ABC |
Ar |
| Ni |
231.648 |
radial |
Peak |
1 |
3 |
ABC |
Ar |
| Pd |
360.995 |
axial |
Peak |
3 |
3 |
ABC |
Ar |
| Pt |
214.424 |
axial |
Peak |
3 |
3 |
static |
Ar |
| Rh |
233.477 |
axial |
Peak |
3 |
3 |
static |
Ar |
| Ru |
245.657 |
axial |
Peak |
3 |
1 |
ABC |
Ar |
1 … Automated Baseline Correction
2 … Argon line at 420.068 nm was used for internal standardization
Results and Discussion
It is widely recognized that emission lines from Cu and other transition metals (e.g., Fe, Ni, Co) can interfere with the analytical lines of certain elements. Specifically, the determination of precious metals and PGMs is significantly hindered in such matrices.
Typically, matrix matching is recommended for calibration to resolve these issues. For this purpose, pure standards or reference materials are required, which show minimal contamination of the elements to be determined.
One effective strategy to address these application challenges is to employ high-resolution instruments capable of separating spectral interferences from the target analytical line.
The results presented here unequivocally demonstrate the significant application advantages afforded by the high resolution (2 pm @ 200 nm) of the PlasmaQuant 9200 Elite system, particularly when compared to instruments with lower resolution, enabling the selection of appropriate and sensitive analytical lines for most elements.
The plasma geometry and the efficient expulsion of the plasma tail using argon (recycled from the optical system purge) as a counter gas contribute to the instrument's high sensitivity. This leads to method-specific detection limits well below 1 mg/kg for all analytes.
Table 4. Results of the samples, instrumental (ILD) and method-specific limits of detection (MLD, considering dilution factor). Source: Analytik Jena
| Element |
ILD1
[μg/L] |
MLD2
[mg/kg] |
Copper
ore
[mg/kg] |
Cobalt
copper
ore [mg/kg] |
Black
copper
[mg/kg] |
Copper
concentrate
[mg/kg] |
Blister
copper
[mg/kg] |
Cathode
copper
[mg/kg] |
| Ag |
0.21 |
0.052 |
< MLD |
< MLD |
10.8 |
6.96 |
8.03 |
0.139 |
| Au |
1.68 |
0.422 |
< MLQ |
1.67 |
< MLQ |
3.78 |
0.535 |
< MLD |
| Ge |
1.65 |
0.466 |
< MLD |
< MLD |
3.14 |
< MLD |
3.72 |
< MLD |
| In |
4.08 |
0.559 |
< MLD |
< MLD |
< MLD |
< MLD |
3.15 |
< MLD |
| Ir |
4.35 |
0.538 |
< MLD |
< MLD |
< MLD |
< MLD |
< MLD |
< MLD |
| Ni |
0.37/
2.773 |
0.098/
0.2903 |
92.7 |
1,6363 |
1,0663 |
49.6 |
3943 |
0.277 |
| Pd |
1.58 |
0.155 |
< MLD |
< MLD |
< MLD |
< MLD |
< MLD |
< MLD |
| Pt |
2.58 |
0.336 |
< MLD |
< MLD |
< MLD |
< MLD |
< MLD |
< MLD |
| Rh |
2.23 |
0.186 |
< MLD |
< MLD |
< MLD |
< MLD |
< MLD |
< MLD |
| Ru |
0.67 |
0.068 |
< MLD |
< MLD |
< MLD |
< MLD |
< MLD |
< MLD |
1 … determined in ∼5 %/15 % (v/v) HNO3/HCl
2 … determined in ∼5 %/15 % (v/v) HNO3/HCl + 10 g/L Cu
3 … determined with radial view
MLQ: method-specific limit of quantification (considering digestion and dilution factors)
The versatile Dual View PLUS plasma observation system permits the determination of trace, minor, and macro elements in a single analytical run, as was done for the varying nickel concentrations in the samples (see Table 4). This approach reduces sample preparation time by eliminating the necessity of sample pre-dilution.
Due to the inherent composition of the ore, it proved difficult to select a suitable internal standard (e.g., Co, indium (In), scandium (Sc), yttrium (Y), etc.) to compensate for matrix effects.
However, the objective of this study was to develop a method applicable across the entire copper value chain. Therefore, results were corrected by employing the argon emission line at 420.068 nm to encompass all matrices with a single method.
Spiking experiments were conducted to exemplify the applicability of the analytical method. The recoveries obtained were within ± 20 % for all elements (Figure 2), underscoring the suitability of the employed analytical method.
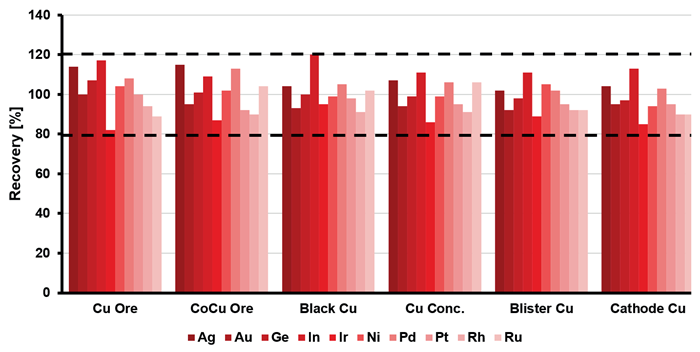
Figure 2. Method-specific recovery rates for the analytes at a spike level of a 0.5 mg/L. Image Credit: Analytik Jena
Furthermore, long-term stability was investigated by monitoring the results from a cathode copper sample over a 12-hour period. In this study, it demonstrated recoveries within the range of ± 6 % (for analytes, see Figure 3) and ± 2 % (for the internal standard, see Figure 4).
Relative standard deviations below 2 % (for analytes, Figure 3) and 1 % (for the internal standard, Figure 4) indicate a highly stable performance of the instrumentation throughout the 12 hours of measurement.
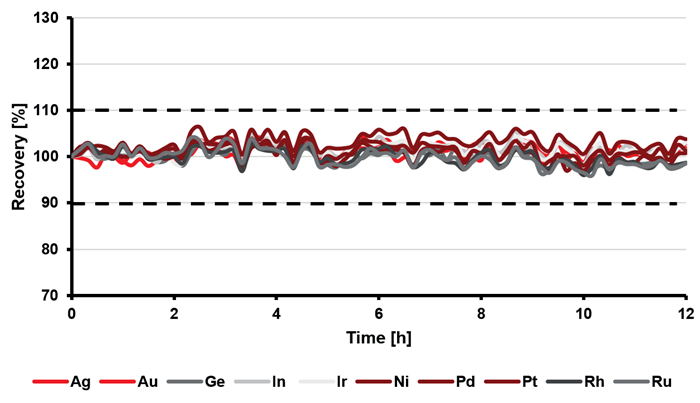
Figure 3. Percentage recoveries of the analytes (1 mg/L spike) in a 10 % (w/v) copper solution throughout a 12-hour sequence. Image Credit: Analytik Jena
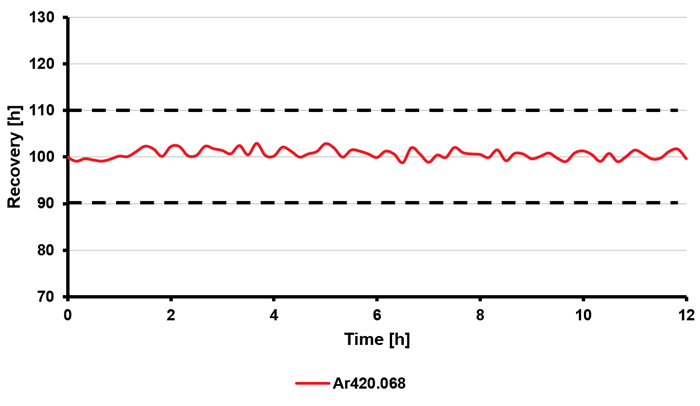
Figure 4. Percentage recovery of the internal standard (argon) throughout a 12-hour sequence in a 10 % (w/v) copper solution; RSD value was below 1 %. Image Credit: Analytik Jena
Interference-free detection of trace signals is a fundamental requirement for reliable and accurate monitoring of copper materials throughout the entire refining process. Trace signals can be easily compromised by matrix components.
In this context, high spectral resolution provides well-separated peaks with high definition, thus mitigating the risk of spectral interferences in copper analysis. Figure 5 presents a comparative spectral analysis using gold (Au) and indium determined in a copper concentrate sample.
The spectra from an instrument with average spectral resolution (Figure 5, left) reveal inadequate separation of the analytes from surrounding matrix peaks, rendering the use of this line for consistent quantification impossible.
In such cases, employing an alternative, less sensitive line becomes unavoidable, leading to worse detection limits and inferior precision and accuracy at the limit concentration.
In contrast to average resolution, the high spectral resolution (Figure 5, right) of the PlasmaQuant 9200 Elite yields a baseline-separated signal for Au and In.
Consequently, sensitive quantification of both elements remains available, resulting in the lowest possible MDL and the highest reliability of the obtained results. The high spectral definition also provides improved sensitivity by increasing peak heights and readings for a standard three-pixel peak evaluation, as commonly applied in ICP-OES.
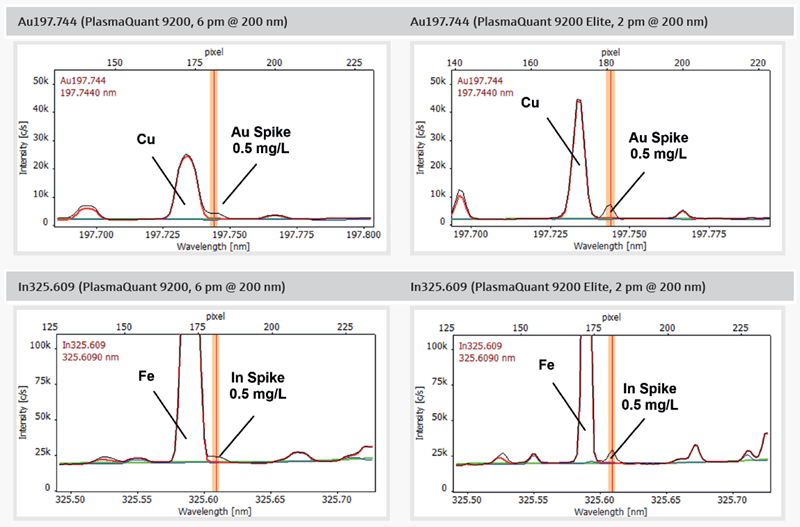
Figure 5. Comparison of PlasmaQuant 9200 (6 pm @ 200 nm) and PlasmaQuant 9200 Elite (2 pm @ 200 nm) illustrating the application advantage of high-resolution spectra (red: sample, blue: blank, black: spike, green: baseline correction (ABC)). Image Credit: Analytik Jena
Summary
In conclusion, the PlasmaQuant 9200 Elite is effective for applications involving copper and copper ore. Its high resolution, superior sensitivity, and robust plasma enable the straightforward determination of trace elements in such materials.
The system's suitability was validated through long-term stability and spike recovery tests. The presented method is able to analyze copper samples across various matrix compositions.
Figure 6. PlasmaQuant 9200 Elite. Image Credit: Analytik Jena
Recommended Device Configuration
Table 5. Overview of devices, accessories, and consumables. Source: Analytik Jena
| Article |
Article number |
Description |
| PlasmaQuant 9200 Elite |
818-09201-2 |
High resolution ICP-OES |
SALT Kit for PlasmaQuant
9x00series |
810-88009-0 |
Sample introduction kit for medium TDS concentrations |
| Teledyne Cetac ASX-560 |
810-88015-0 |
Autosampler with integrated rinse function |

This information has been sourced, reviewed and adapted from materials provided by Analytik Jena.
For more information on this source, please visit Analytik Jena.