Polymers are large chains of molecules made up of many smaller molecules (monomers) joined in a repeating pattern. They can be natural or synthetic and are found in many everyday products and materials. Examples include plastics, biopolymers, cosmetics, hair care products, contact lenses, food, tires, and fabric.
Polymers have unique physical properties, such as toughness, high elasticity, and viscoelasticity.
Quality control testing for polymers at all stages of the manufacturing process often relies on expensive, time-consuming wet-chemistry methods. Most tests can measure only a single chemical or physical parameter and are ill-suited for real-time use in a process setting. While NIR spectroscopy requires calibration models that correlate it with the chemical and physical parameters of interest, its benefits are vast once these models have been created.
NIR spectroscopy offers the advantages of being fast, non-invasive, and cost-effective. It requires little to no sample preparation, and no chemicals or solvents are required for analysis. NIR spectra come from the combination and overtone bands of C-H, N-H, and O-H vibrations.
Polymer chemistry and reaction mixtures contain organic compounds with these bonds, making them ideal for NIR analysis. NIR spectroscopy can measure both chemical and physical properties, and is suitable for research, quality control, specification testing, and process control.
Fourier Transform (FT) NIR spectrometers are particularly well-suited for polymer analysis, using an interferogram signal that is transformed into a spectrum of frequency versus intensity. They contain an internal reference laser for accurate wavelength calibration and are unaffected by stray light.
These spectrometers are fast, measure all wavelengths simultaneously, and offer higher resolution and greater signal energy than other NIR spectrometers. For practical purposes, the biggest advantage of FT-NIR spectrometers is reproducibility. Requirements are minimal for calibration transfer between instruments, even those from different vendors.
In the sections below, an overview of polymer manufacturing and applications using NIR spectroscopy is presented. The method has practical applications for off-line, at-line, and on-line use, the differences between which will be explored in the article, along with specific use cases.
Polymer Manufacturing and Applications
Polymer manufacturing is the process of converting raw materials into finished products with desired properties, shape, and microstructure. It can be a batch or continuous process depending on the application. Optimization of the complex manufacturing process involves numerous chemical and physical properties, many of which cannot be analyzed in real time using traditional methods.
NIR spectroscopy is a proven method for determining important properties in polymer analysis. Examples of applications for polymer analysis using NIR spectroscopy include hydroxyl (OH) number, acid value, amine value, isocyanate (NCO) value, dry extract, residual moisture, free monomer content, melt flow index (MFI), density, viscosity, melting point, degree of polymerization, cross-linking, and tacticity.
The sections below provide an overview of different polymer applications using NIR spectroscopy, divided into off-line, at-line, and on-line applications.
Off-Line Polymer Applications
An off-line NIR spectrometer is an instrument typically used in an external laboratory, away from the main source of the sample, requiring the sample to be brought to the instrument. Advantages include use in a controlled environment and lower cost, as such instruments do not require specifications that instruments in a manufacturing environment often need (such as explosion-hazard and anti-vibration design). Disadvantages include the need for controlled sample transport and the inability to perform real-time, continuous monitoring.
There are numerous proven off-line applications using NIR spectroscopy. Many such applications involve quality control testing for material sorting. NIR spectra of various polymers are often distinct among similar products and can be used to classify materials. Examples of this include sorting of marine waste, recyclable materials, biodegradable plastics, and final manufactured products.
One example of recycling sorting is the separation of nylon 66, nylon 6, polyethylene (PET), and polypropylene. Another is to distinguish the biodegradable plastic Polylactic Acid (PLA) from regular plastics such as PET, polypropylene, and polystyrene.
NIR spectroscopy can be used to quantitatively classify the density levels of the same product and measure density. Polyethylene is a thermoplastic made from the polymerization of ethylene, used in various products such as packaging films, toys, pipes, and housewares.
Density is an important physical parameter in polymers and is used to calculate the percentage of a polymer that is crystalline. Polyethylene can be classified as high-density, medium-density, linear low-density, and low-density. NIR spectra of the four groups are distinct enough to classify each group. The correct group can be classified, and local calibration models can provide a quantitative value for density from the NIR spectra.
Galaxy Scientific Off-Line Polymer Application
Galaxy Scientific has developed numerous polymer applications using FT-NIR spectrometers. The following application was developed in-house using the Galaxy Scientific QuasIR™ 3000 FT-NIR spectrometer.
Styrene butadiene copolymer (SBC) is a thermoplastic made from a combination of styrene and butadiene. It is transparent, easy to melt, and can be highly colored with a good balance of rigidity, stiffness, and toughness. SBC can be used to make adhesives, sealants, toys, appliances, respiratory devices, blister packs, asphalt materials, and many other products, and sees widespread use in rubber and latex products.
Different products require different percentages of styrene and butadiene, making a final quality test for the proper percentages in SBC paramount. The traditional method for determining styrene percentage in SBC is nuclear magnetic resonance (NMR), which is effective but extremely expensive and time-consuming.
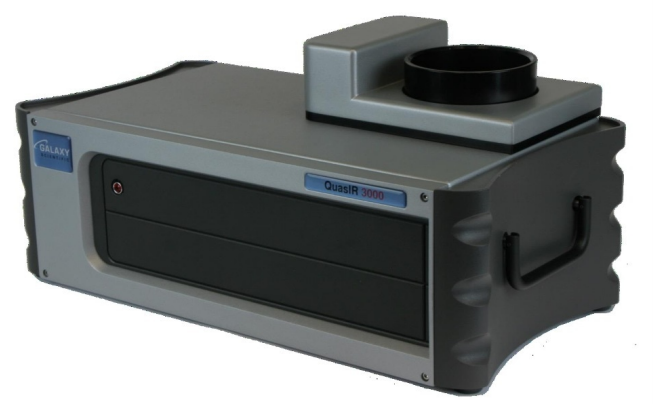
Figure 1. Galaxy Scientific QuasIR™ 3000 FT-NIR Spectrometer. Image Credit: Galaxy Scientific Inc
Samples of SBC pellets at five styrene content levels, ranging from 65% to 82%, were procured for the study. The Galaxy Scientific FT-NIR spectrometer shown above was used to collect NIR spectra of all samples from 10,000 cm-1 to 4000 cm-1, at 8 cm-1 resolution.
Samples were spun in the sample spinner to minimize the effect of inhomogeneity. Sixty-four scans were collected per sample and averaged into one spectrum to reduce noise. After various pre-processing algorithms were applied to the spectral data, the NIR spectra and reference values for percent styrene were used to create a Partial Least Squares (PLS) regression model correlating the NIR spectra to the percent styrene.
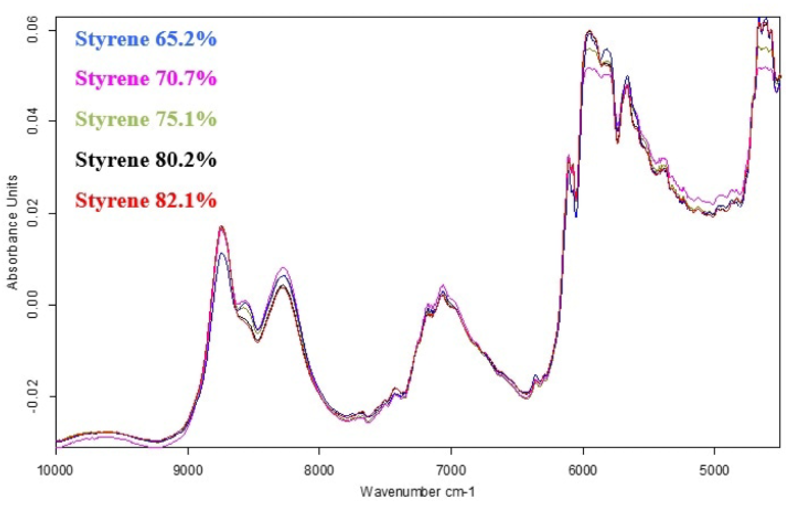
Figure 2. FT-NIR Spectra of SBC Pellets. Image Credit: Galaxy Scientific Inc
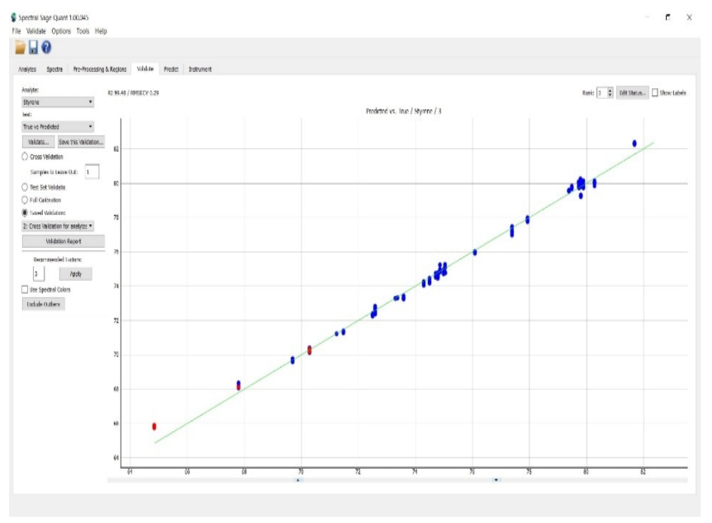
Figure 3. PLS Model for percent styrene in SBC Pellets. Image Credit: Galaxy Scientific Inc
Model statistics showed good correlation between values predicted from the NIR spectra and the reference values for percent styrene. The model was validated using cross-validation. Results proved the validity of the model, and the error of prediction was less than 0.3%.
At-Line Polymer Applications
An at-line NIR spectrometer refers to an instrument that is used in a manufacturing environment but is not placed in the actual process. At-line instruments are placed next to the process, and like off-line instruments, they require the sample to be brought to the instrument.
For polymers, this can entail a worker physically pulling out a sample for scanning, or an automated sampling system can be used. This requires proper disposal of the sample after sampling or further sample analysis by a traditional method; this is sometimes done for validation purposes to ensure the NIR spectrometer measurements are accurate.
Some at-line applications involve using a probe brought to the sample itself. Many polymer materials are hazardous and must be handled carefully, even when transported over a short distance. Analysis is faster than for off-line instruments, but at-line instruments are not suited for real-time monitoring.
Two prominent applications of NIR spectroscopy in an at-line environment are the determination of the hydroxyl (OH) number and the acid number. Both are a final product quality indicator in polyols, which are produced from reacting an alkylene oxide and initiator in a catalytic environment.
Polyols react with isocyanates (NCO) to produce polyurethane products, which are one of the largest groups in polymer manufacturing. The standard method for determining both numbers requires titration, which typically takes one to three hours and requires the use of large amounts of chemical reagents.
At-line analysis of the OH number during polyol production helps determine the extent of the reaction and the quantity of urethane linkages, which influences the physical properties of the final polyurethane product. The acid number is an important measure of polymer functionality and is often used to ensure batch-to-batch uniformity. The sum of acid and hydroxyl numbers is the “End Group Number”.
Galaxy Scientific At-Line Polymer Application
The following application was developed in-house using the Galaxy Scientific QuasIR™ 4000 FT-NIR spectrometer. Features of the QuasIR™ 4000 include a temperature-controlled sample compartment and integrating sphere channels.
Samples of polyether polyol were procured for the study. Polyethers are a class of polymers that are characterized by the -O- connection and can be aliphatic or aromatic. Common polyethers include polyethylene oxide (PEO) and polypropylene oxide (PPO). Many polyethers are biodegradable and have biomedical and petrochemical applications.
Figure 4. Galaxy Scientific QuasIR™ 4000 FT-NIR Spectrometer. Image Credit: Galaxy Scientific Inc
NIR spectra were collected for tt samples over the wavenumber range of 10,000 cm-1 to 4000 cm-1. After the spectral data were pre-processed, Spectral Sage™ software was used to create a Partial Least Squares (PLS) calibration model to correlate the NIR spectra to the hydroxyl value. The software used two separate wavenumber regions for the calibration: 5060 cm-1 to 4575 cm-1, and 9000 cm-1 to 6100 cm-1.
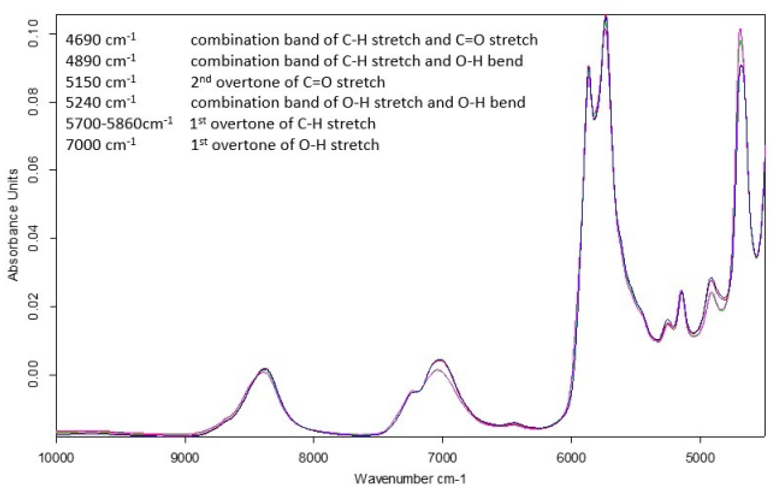
Figure 5. FT-NIR Spectra of Polyether Polyols. Image Credit: Galaxy Scientific Inc
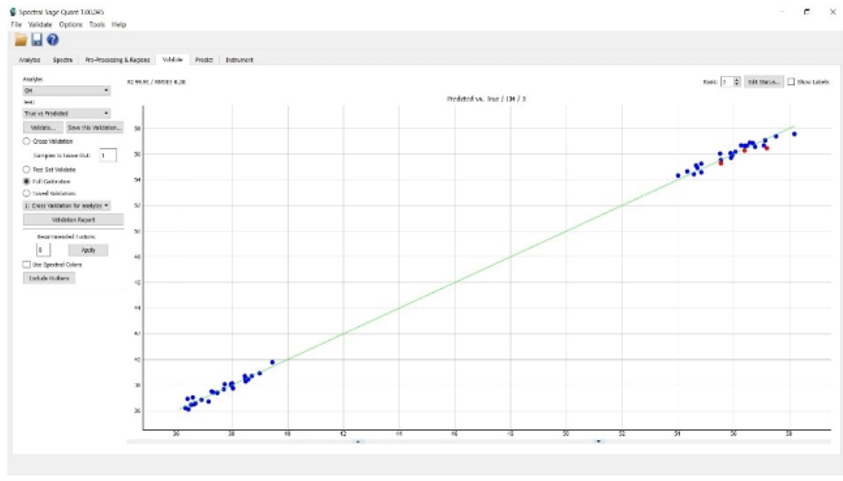
Figure 6. PLS Model for Hydroxyl Value. Image Credit: Galaxy Scientific Inc
The PLS model was validated using cross-validation, which generated excellent results and a high correlation. The expected prediction error was low, at 0.32 mg KOH/g.
On-Line Polymer Applications
An on-line NIR spectrometer refers to an instrument that is placed in a manufacturing environment for direct, real-time measurements of a product as it is being made. Such instruments often use fiber-optic probes that can be either placed above the manufacturing area for reflectance measurements or inserted directly into a reactor or similar chamber containing a liquid.
Harsh manufacturing environments make it essential to ensure that both the spectrometer itself and related hardware can withstand vibration and exposure to toxic substances across varying temperature, humidity, and pressure conditions.
The benefits of such analysis far outweigh the negatives despite the challenges of using an FT-NIR spectrometer in a harsh environment. On-line analysis expands NIR spectroscopy from an off-line method to a real-time process control tool.
Most traditional methods for determining chemical and physical parameters of interest in polymer manufacturing cannot be used for real-time measurements. Advances in software and hardware have facilitated the use of NIR spectroscopy for process monitoring. Improved fiber optics, interfaces, flanges, and probes in high-pressure and high-temperature environments have increased the accuracy of measurements and helped prevent hardware breakdowns.
Viscosity, the measure of the resistance of a fluid to deformation at a given rate, is measured on-line. Measuring viscosity determines the polymer chain length, and because viscosity increases rapidly with increasing molecular weight, it is an important parameter of polymer reaction progression. Optimizing reaction time and knowing when the reaction is complete in real time helps save labor, time, and resources in polymer manufacturing.
Melt Flow Index (MFI) is another example of a polymer manufacturing application where on-line analysis is greatly beneficial. It is a measure of the ease of flow of a thermoplastic polymer and of the resistance of a polymer melt at a specific temperature under a given force for a predetermined duration.
It is inversely proportional to molecular weight, with a high MFI corresponding to a low molecular weight. While it is inversely proportional to viscosity as well, viscosity is also dependent on the applied force. Thus, the MFI ratio at two different pressures is a measure of the broadness of the molecular weight distribution.
The benefit of real-time MFI analysis is ensuring that the proper engineering design is achieved. Polymers must be designed with an MFI high enough to form the molten polymer into the desired product, but low enough to ensure that the finished product's mechanical strength is sufficient. Real-time MFI feedback via NIR spectroscopy during reactions enables adjustments to ensure proper specifications are met.
Polyurethanes are one of the most prominent polymer product groups. They are formed by the reaction of polyols and isocyanates (NCO), with a catalyst and additives. The first step in polyurethane manufacturing is to produce a precursor to the final product by reaction of a polyol with excess NCO.
The ratio of the reactive groups is of paramount importance as some reactive NCO must be left to complete the reaction and form specific products later, such as foam, lacquers, insulation, adhesives, and fibers. Real-time NCO concentration analysis is extremely beneficial for both determining the optimal addition of additives to the reactor and knowing when the desired NCO concentration is obtained to stop the reaction at the proper endpoint.
In addition, NCO is an extremely hazardous material and is difficult to sample. The traditional method for measuring NCO is titration, which requires the use of toxic chemicals and takes one to three hours to complete, making it ill-suited for real-time analysis. The benefits of using NIR spectroscopy for real-time determination of NCO concentration in a reactor cannot be understated.
Galaxy Scientific At-Line Polymer Application
A Galaxy Scientific QuasIR™ 2000 FT-NIR spectrometer was used to develop a calibration model for the on-line monitoring of NCO during a polyurethane reaction. NIR spectra were collected directly from the reactor using a process transmission probe with a 5 mm pathlength. As the NIR spectra were collected, a sample was pulled from the tank at the same time, and corresponding reference values for NCO were determined using the traditional titration method.
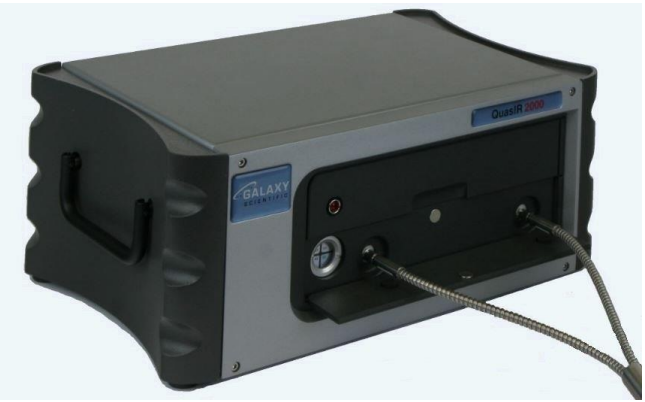
Figure 7. Galaxy Scientific QuasIR™ 2000 FT-NIR Spectrometer with Standard SMA Connectors. Image Credit: Galaxy Scientific Inc
All samples were scanned from 10,000 cm-1 to 4000 cm-1 at 8 cm-1 resolution. Twenty scans were collected per reading and averaged into a single spectrum. Various pre-processing algorithms were applied to the spectral data before chemometric modeling, including normalization, to reduce the effects of baseline shifts. The NIR spectra and reference values were used to create a Partial Least Squares (PLS) model correlating the NIR spectra to NCO concentration.
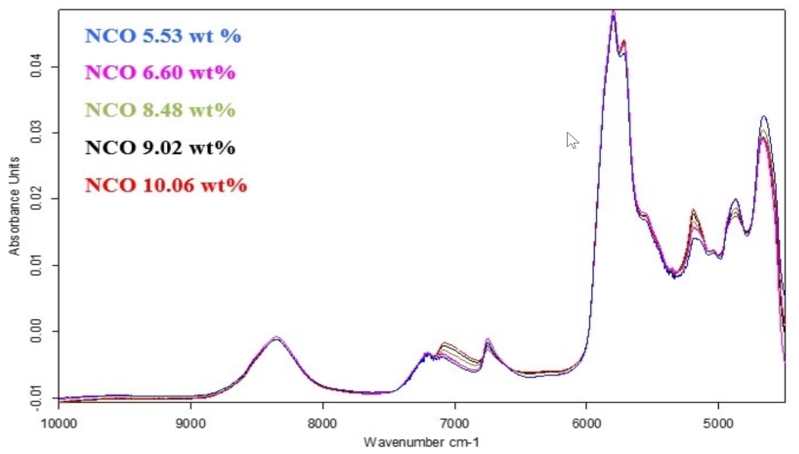
Figure 8. FT-NIR Spectra of Polyurethane Samples with Varying NCO Concentration. Image Credit: Galaxy Scientific Inc
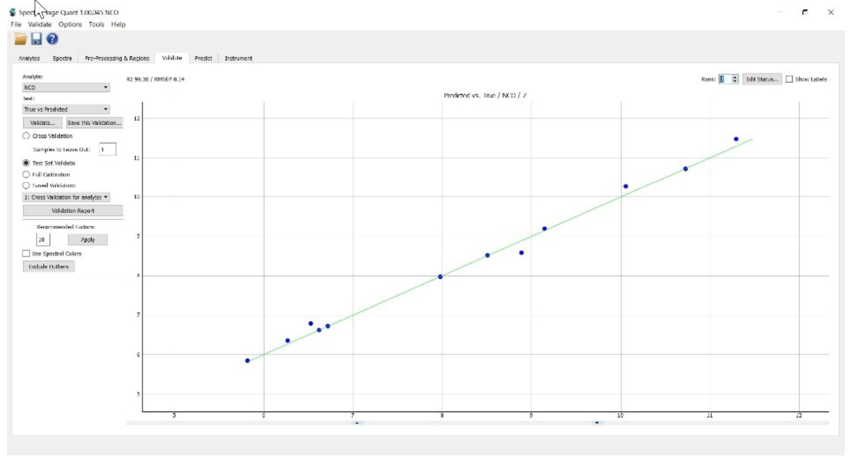
Figure 9. PLS Model for NCO Concentration. Image Credit: Galaxy Scientific Inc
Visual examination of the NIR spectra for the different NCO concentrations shows clear differences around 7000 cm-1. This is the wavenumber corresponding to the first overtone of the O-H stretch, and it is an area where spectral differences related to varying NCO concentration are expected.
The calibration model showed excellent results, and model validation was performed by collecting NIR spectra from three independent reactor batches. Values for NCO were predicted using the independent spectra and calibration model.
Reference values were obtained, and they were in good agreement with the prediction values, with an average prediction error of 0.14%. Validation proved the feasibility of using a Galaxy Scientific FT-NIR spectrometer to perform real-time monitoring of NCO concentration in a reactor.
Recent Advances
Many applications of NIR spectroscopy for polymer analysis have been in use for a long time. As reviewed in the previous sections, much recent work has focused on shifting the use of NIR spectrometers from laboratory instruments to real-time process control tools.
However, there has been recent research focusing on new types of analysis using NIR spectroscopy for polymer applications. These include using NIR spectroscopy in tandem with other sensors to predict the mechanical strength of an extruded polylactide (PLA) product, advanced calculations used to simulate NIR spectra of polymers to improve structural specificity analysis, and investigating water interaction and its effects on polymer matrices using NIR spectroscopy.
Process Analytical Technology (PAT)
Process Analytical Technology (PAT) was first introduced by the FDA for the pharmaceutical industry, but has proven effective as a modeling and control strategy in the polymer industry. There is vast potential to benefit polymer manufacturing and quality control processes by using the principles of PAT to ensure quality.
Some general ideas and principles of PAT include preventing batch rejection, increasing automation and control, optimizing energy use, continuous processing rather than batch processing, improving environmental impact, and manufacturing biodegradable materials.
Inherent advantages of implementing PAT into polymer analysis include controlled and optimized use of raw materials, reduction in variation of the final product, waste reduction, minimization of process cycle time, and the replacement of slow, costly, and ineffective laboratory testing methods with newer and more reliable sensor technologies, such as NIR spectroscopy.
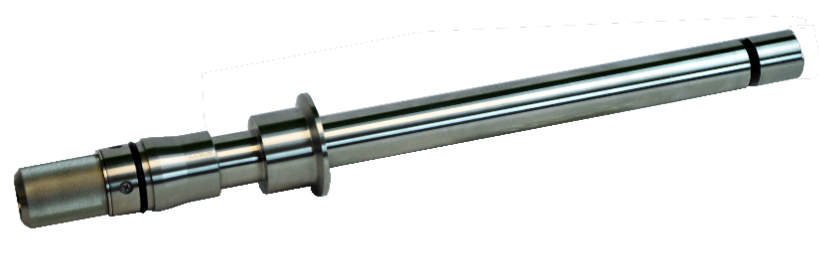
Image Credit: Galaxy Scientific Inc
Galaxy Scientific
Galaxy Scientific is an industry pioneer in the use of optical Near Infrared Spectroscopy. Our QuasIR™ family of NIR spectrometers uses Fourier Transform Near-Infrared (FT-NIR) technology for laboratory, field, and process applications. Our passion is innovation and our mission is to develop uniquely robust NIR instruments to solve critical analytical problems in numerous sectors, including polymer manufacturing.
For more information about Galaxy Scientific and to contact one of our applications specialists, please visit our website at Galaxy Scientific Inc.
For more detailed discussion on the topics covered in this article and for further discussion on polymer monitoring using NIR spectroscopy, please visit the following section on the Galaxy Scientific website: Advanced FT-NIR Analysis for Chemicals & Polymers.
This information has been sourced, reviewed, and adapted from materials provided by Galaxy Scientific Inc.
For more information on this source, please visit Galaxy Scientific Inc.