Dairy products are derived from milk and are an important source of nutrition. Milk consists of water, carbohydrates, fat, vitamins, minerals, and protein. The carbohydrates in milk come from lactose, a type of natural sugar. Milk fat is both the primary energy component in milk and a contributor to taste and texture. Major dairy products made from milk include cheese, butter, yogurt, cream, ice cream, and whey.
Most chocolate products contain milk, and these can be classified as dairy as well. Essential nutrients in dairy products include protein, calcium, vitamin B12, vitamin D, vitamin A, zinc, and selenium. Standard methods for quality control analysis of dairy products are time-consuming, expensive, labor-intensive, and often require both extensive sample preparation and the use of toxic chemicals and solvents. NIR spectroscopy offers an alternative method for the analysis of chemical and physical parameters in dairy products.
The dairy market in the United States is estimated at $111.6 billion in 2025 and is expected to reach $133 billion by 2030, growing at a CAGR of 3.57 % during this timeframe. Beverage milk accounts for the largest revenue share at around 33 %. The production of milk in the United States in 2023 was estimated at 226.6 billion pounds, which was a record high, and production is expected to continue to increase. By one estimate, about 37 % of milk produced is consumed as fluid milk and cream, about 32 % is converted into various cheeses, about 17 % is made into butter, and about 8 % is used to make ice cream, yogurt, and other frozen desserts. The remainder is sold as dry milk, canned milk, and other types of milk products.
Much attention has been paid to the detection of the quality and safety of liquid foods because of their various raw materials. This is especially true for dairy products because of their perishability. Along with processing techniques like drying, heating, cooling, freezing, and pasteurizing, there is also a need for rapid and cost-effective methods to analyze and classify quality, especially when considering the large amount of variability of dairy products in the market.
Moreover, consumer awareness of quality assurance amongst brands is a major factor in consumers’ decisions to purchase dairy products. The implications of poor product quality spreading in today’s social media environment, as well as the financial consequences of a product recall, can be devastating to a company’s bottom line.
Traditional testing methods for dairy analysis often include time-consuming and expensive wet chemistry methods. They are labor-intensive, require the use of toxic chemicals and solvents, and are ill-suited for real-time on-line analysis. Most testing methods are also only capable of measuring a single chemical or physical parameter of interest per test.
Developing rapid, non-invasive, cost-effective, and environmentally sound methods for quality testing has become a priority for dairy manufacturers. One such method with potential for both laboratory and industrial testing of dairy products is NIR spectroscopy.
Dairy Quality Control and NIR Spectroscopy
Dairy manufacturing and quality control equipment encompasses a wide range of machinery and instruments used in the processing, testing, and packaging of milk and milk products. They are designed to ensure product safety and consistency while maintaining adherence to quality standards and regulations throughout the dairy production process.
The standard macronutrient contents of milk are water, fat, protein, lactose, and total solids (non-water components). Ash is an indicator of mineral composition. Quality control monitoring equipment in milk and dairy products includes pH meters, turbidity sensors, conductivity meters, oxygen sensors, titrators, refractometers, density meters, metal detectors, microbiological testing equipment, and various process control monitors.
Given the vast scope and cost of equipment required for the manufacturing of dairy products, it is of paramount importance to manufacturers to develop fast and accurate quality control methods, especially for on-line monitoring. Most of the equipment listed can only measure a single chemical or physical parameter of interest per test. These methods are not only time-consuming, but also require the use and disposal of toxic chemicals and solvents, and are ill-suited for both large-scale testing and real-time on-line analysis. However, one type of instrument that is proven to be able to accurately determine numerous quality control parameters in dairy products is a NIR spectrometer.
NIR spectroscopy can be used for quality analysis of chemical and physical parameters in dairy products, including milk, butter, cheese, yogurt, cocoa, and chocolate. It offers the advantages of being fast and non-invasive. Sample preparation is minimal, and no toxic chemicals or solvents are required. Unlike traditional methods, NIR spectroscopy can determine multiple chemical and physical parameters with a single measurement. Examples of proven NIR spectroscopic applications for dairy analysis include fat, protein, moisture, lactose, ash, and total solids.
While NIR spectroscopy has long been used as an off-line method for quality analysis of dairy products, technological advances have facilitated its use as a real-time process control tool. Hardware advances in instrument design, probes, in situ sampling, and fiber optics have enabled instruments to be used in manufacturing environments.
NIR spectroscopy can also be used for adulteration detection in dairy products. Adulteration can constitute many different forms and methods. These include the misidentification of a product or the addition of cheaper ingredients. For more information about the use of NIR spectroscopy in dairy adulteration detection, please visit the following section on the NIR-For-Food website: https://nir-for-food.com/dairy-adulterant/
In the sections below, two Galaxy Scientific in-house dairy application studies are discussed.
Galaxy Scientific In-House Application Study – Protein in Milk Powder
An application study was performed at Galaxy Scientific using a QuasIR™ FT-NIR spectrometer for the purpose of measuring protein in milk powder. Samples of milk powder with known reference values for protein were procured for the study. The range of protein values was wide enough to encompass standard protein values in milk powder, as calibration models can only accurately measure within the range from which they are created.
FT-NIR spectra were collected for all samples using the QuasIR™ FT-NIR spectrometer and Spectral Sage™ software. Standard parameters were used for the wavenumber range and resolution. Collection time per sample was approximately 30 seconds. Various pre-processing algorithms were applied to the spectral data before chemometric modeling. These algorithms can improve modeling performance by reducing the effects of baseline shifts, noise, scattering, and overlapping peaks.
A Partial Least Squares (PLS) chemometric model was created to correlate the NIR spectra of the milk powder samples to protein value. PLS models use multivariate analysis to correlate X-variables (FT-NIR spectra) to a Y-variable (protein). Once the model is created, a milk powder sample can be scanned, and a predicted value for protein can be obtained from the FT- NIR spectrum. Cross-validation was used to validate the model. This method pulls out one or more data points (NIR spectra), creates a new model without those data points, and uses the new model to predict a protein value for the removed data points. The predicted value is then compared to the protein reference value to determine the accuracy of the prediction. Cross-validation modeling results are shown in the figure below.
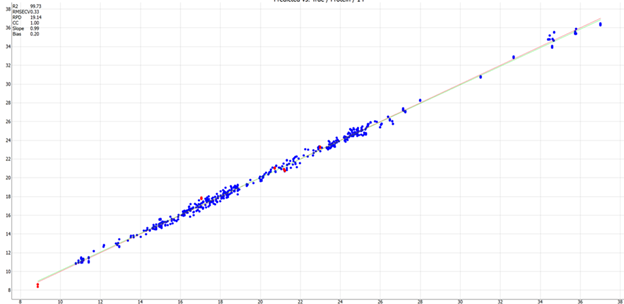
Figure 1. PLS Cross Validation for Protein in Milk Powder. Image Credit: Galaxy Scientific Inc
The correlation coefficient, R2, is a measurement of the correlation between the predicted values obtained from the cross-validation calibration models and FT-NIR spectra vs. the reference method value. The R2 value of higher than 0.99 shows that this method can be used to accurately measure protein in milk powder. The Root Mean Square Error of Cross-Validation (RMSECV) is a metric used to evaluate the predictive performance of a calibration. RMSECV quantifies the average prediction error during cross-validation. The low value of 0.33 also shows that a Galaxy Scientific QuasIR FT-NIR spectrometer can be used to accurately measure protein in milk powder.
Galaxy Scientific In-House Application Study – Total Sugars in Chocolate
An application study was performed at Galaxy Scientific using a QuasIR™ FT-NIR spectrometer for the purpose of measuring total sugars in chocolate. Samples of chocolate with known reference values for total sugars were procured for the study.
FT-NIR spectra were collected for all samples using the QuasIR™ FT-NIR spectrometer and Spectral Sage™ software. Data collection and processing were the same as in the previous example. Cross-validation modeling results are shown in the figure below.
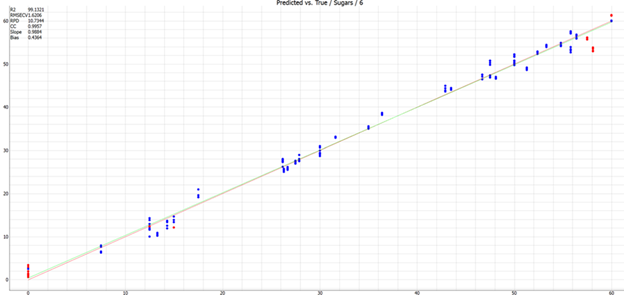
Figure 2. PLS Cross Validation for Total Sugars in Chocolate. Image Credit: Galaxy Scientific Inc
The R2 value of higher than 0.99 shows that this method can be used to accurately measure total sugars in chocolate. The low value of 1.62 for the RMSECV shows that a Galaxy Scientific QuasIR FT-NIR spectrometer can be used to accurately measure total sugars in chocolate.
Other Studies on the Use of NIR Spectroscopy for Dairy Products
More information about published studies on the use of NIR spectroscopy for dairy analysis, including milk, cheese, butter, yoghurt, and chocolate, can be found at www.nir-for-food.com.
About Galaxy Scientific
Galaxy Scientific is an industry pioneer in the use of optical Near Infrared Spectroscopy. Our QuasIR™ family of NIR spectrometers uses Fourier Transform Near-Infrared (FT-NIR) technology for laboratory, field, and process applications. Our passion is innovation, and our mission is to develop uniquely robust NIR instruments to solve critical analytical problems in numerous sectors, including the dairy industry.
For more information about Galaxy Scientific and to contact one of our applications specialists, please visit our website at Galaxy Scientific Inc.
For more detailed discussion on the topics covered in this article, including advanced statistics, an overview of the manufacturing processes for dairy products, and a review of applications studies for dairy analysis using NIR spectroscopy, please visit the following sections on the Galaxy Scientific NIR spectroscopy for food analysis website: Dairy - NIR-For-Food.
This information has been sourced, reviewed, and adapted from materials provided by Galaxy Scientific Inc.
For more information on this source, please visit Galaxy Scientific Inc.