Polyolefins, or polyethylene and polypropylene, are high-performance polymers made from ethylene and propylene. These materials, known for their high chemical resistance, durability, and flexibility, are used in a variety of industries.
They are commonly used in packaging solutions such as films, containers, and bags to provide both protection and convenience.
Polyolefins are important in the construction industry because of their robustness and long service life in products such as roofing membranes, insulation materials, and piping systems. They are also valued in the automobile sector due to their low weight, impact resistance, and ability to survive harsh climatic conditions.
This makes them well-suited for components that need both strength and efficiency. As sustainability becomes more important, advances in polymer manufacturing and the development of biodegradable and recycled-content polyolefins are propelling the next generation of material solutions.
These advancements assist manufacturers and customers in meeting both performance and environmental objectives.
In 2024, the polyolefin market volume was $231 billion USD and is projected to grow at ~5.29% to $ 372 billion by 2034. The Asia-Pacific area dominates this market volume with a share of more than 50%, while Europe and North America account for the majority of the remaining output.
Polyolefin Catalysis
The efficient production of certain polyolefins necessitates the creation and selection of appropriate catalysts. Many chemical corporations are investing heavily in screening facilities for catalysis research as part of their ongoing catalyst development efforts.
Catalysis screening is performed on a laboratory scale, using batch reactors with short polymerization runs of around one hour. Typically, many batch reactors are installed in a single laboratory to ensure that experimental data is collected at the highest possible rate.
One distinguishing aspect of batch reactions for polyolefins over continuous processes employed in plant production is the inability to reach steady-state conditions (in terms of key constituent ratios) without on-line process gas analysis.
For example, in the case of polyethylene (PE), hydrogen is employed to end the polymer chains when the reaction is initiated with a specified H2/C2H4 concentration ratio; if no more H2 is introduced to the system, the H2/C2H4 ratio is soon depleted.
As a result, the polymers formed at the start of the run will have significantly lower molecular weights than those produced at the end. The problem is shown in Figure 1.
This makes it impossible to create catalysts that can run under static conditions to produce a specific polymer product. The solution combines online analysis with system-controlled H2 metering via a mass flow controller.
This solution has been used under experimental conditions to maintain constant H2/C2H4 ratios.
The end result is a limited and symmetrical distribution of polymer molecular weights. This method of catalyst screening simulates actual steady-state plant settings, resulting in statistically accurate data on catalyst performance.
PE polymerization experiments use α-olefins like 1-butene and 1-hexene to get the desired polymer grades, resulting in a comparable outcome. These critical components are depleted throughout manufacturing, but can be controlled at a consistent ratio relative to C2H4 through online analysis.
Polypropylene (PP) experiments employ analogous regulation strategies based on H2/C3H6 and 1-butene/C3H6 ratios. Similarly, C2H4/C3H6 can be controlled to produce ethylene-propylene co-polymers.
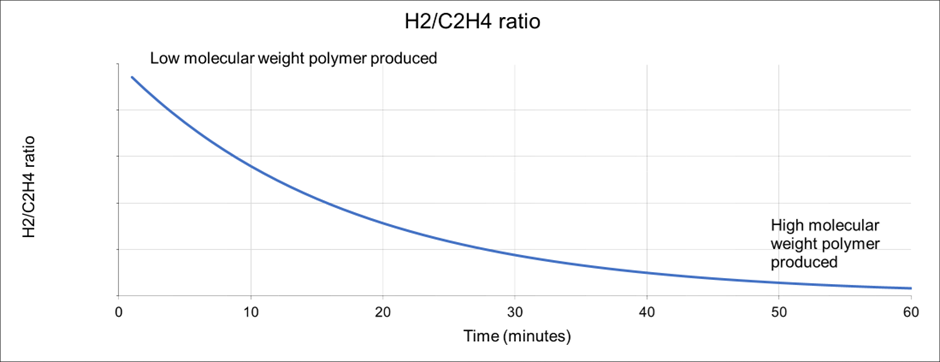
Figure 1. Hydrogen depletion and the effect on polymer molecular weight. Image Credit: Thermo Fisher Scientific – Environmental and Process Monitoring Instruments
HDPE Process Data
The ultimate goal of the research mentioned above is to create a polymer with a very tight (heavy) molecular weight distribution while consuming the least amount of hydrogen possible. To achieve this, various catalysts were tested in the trials. In this study, research reactors use 10 times less hydrogen than a full-scale facility.
Replicating the usage of this innovative catalyst in production reactors will result in much lower hydrogen consumption while producing significantly denser polymer products. This can be validated using mass spectrometry (MS).
Figure 2 demonstrates MS's capacity to measure gas species at catalyst concentrations as low as ~500 ppm for H2 and ~100 ppm for hexene-1 and hexene-2.
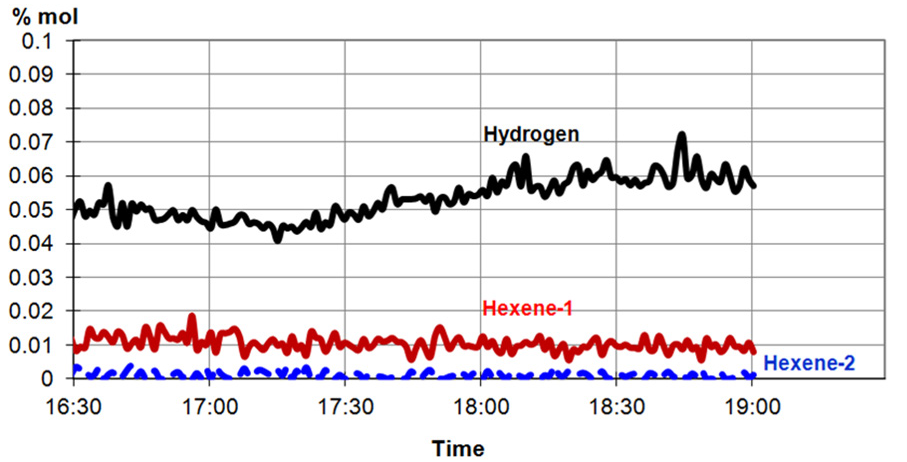
Figure 2. MS analysis of very low concentrations of H2, hexene-1, and hexene-2. Image Credit: Thermo Fisher Scientific – Environmental and Process Monitoring Instruments
Analyzer Selection
A prominent polyolefin manufacturer employed gas chromatography (GC) for online process gas analysis.
The need for several reactors and the shortest achievable cycle periods necessitated specialized GC units for each reactor. However, even in this scenario, the fastest achievable cycle time was five minutes for analysis up to C-4 (eight minutes for C-6), and regulation was judged inadequate.
As a result, MS was considered because it is known to be a very quick technology, giving up to 20 times faster analysis than GC. The Thermo Scientific™ Prima™ Series Process Mass Spectrometer was selected after a thorough study of two options.
The Prima spectrometer is a very precise, robust, and dependable process gas analyzer, with over 1500 units installed worldwide in chemical plants, pharmaceutical operations, iron and steel works, and research laboratories.
Before the Prima series spectrometer was chosen for this application, it was tested in a comparative trial alongside a quadrupole process MS, a process GC, and a laboratory GC to examine a series of samples.
The laboratory GC had been shown to be quite accurate when tested with a variety of certified gas mixture mixes. The results in Figure 3 show that the Prima series process MS performed similarly to the laboratory GC. It can also be seen from Figure 3 that the Prima series method MS gave more accurate results than the process GC.
However, not all types of mass spectrometers are suitable for this analysis. The quadrupole MS (QMS) was shown to give poor accuracy for this application. This is due to the poor and unstable H2 response exhibited by quadrupole systems, arising from the low energy of the ion beam, typically 10 eV or less.
The Prima series method MS employs a very high ion energy (1000 eV), resulting in exceptional reproducibility and precision.
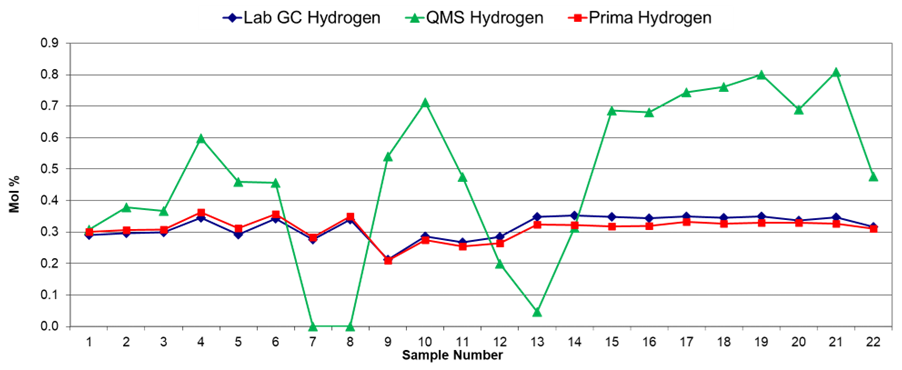
Figure 3. Hydrogen data from lab GC, quadrupole MS, and Prima series process MS systems. Image Credit: Thermo Fisher Scientific – Environmental and Process Monitoring Instruments
A comparison can also be made with the Prima series process MS and process GC, where the subject chemical is ethylene. Figure 4 shows a data set containing 55 analysis points from the lab GC, MS, and process GC.
For consistency across the comparison, the MS was only sampled at the same rate as the GCs, but it can provide data considerably faster if necessary.
It can be seen that there is generally good agreement among all three analyzers, with the lab GC and MS having the closest alignment. The process GC is an outlier, with multiple data points that conflict with both other analyzers.
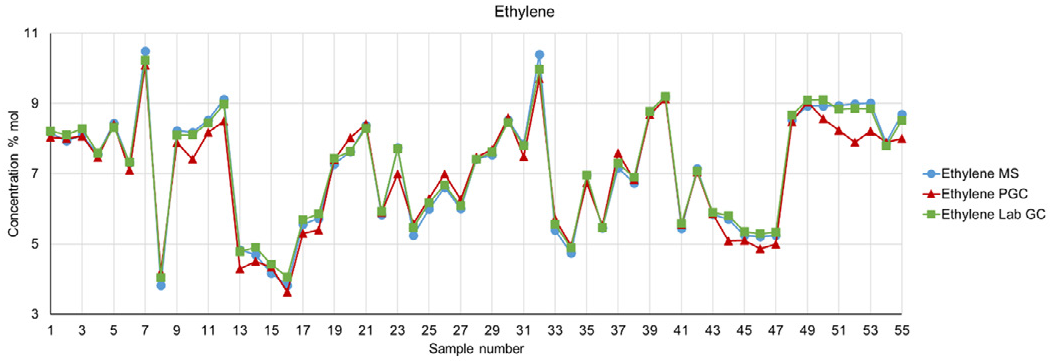
Figure 4. Ethylene data from MS, lab GC, and process GC. Image Credit: Thermo Fisher Scientific – Environmental and Process Monitoring Instruments
Magnetic Sector MS Technology
The selection of MS technology is critical because many mass spectrometers are available, each with its own distinct features. The data presented in this research reveals that not all have the same level of performance.
The scanning magnetic sector MS has been demonstrated over many decades to provide greater analytical performance as well as the capacity to go longer periods between calibration and maintenance.
The scanning magnetic sector MS separates positively charged ions produced by the sample gas molecules in a changing magnetic field before measuring the current created by ions of different masses at a Faraday detector.
The spectral peaks produced by the magnetic field are highly symmetrical, with a flat top. The height of a peak is directly proportional to the component concentration, and its flat top ensures consistent height measurements while being extremely tolerant of minor fluctuations in peak location. Figure 5 shows the design of a scanning magnetic sector MS.
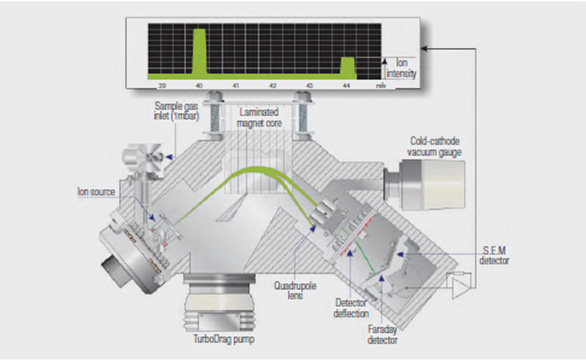
Figure 5. Scanning magnetic sector MS. Image Credit: Thermo Fisher Scientific – Environmental and Process Monitoring Instruments
Prima PRO Process Mass Spectrometer Performance Specifications
The Thermo Scientific™ Prima PRO Mass Spectrometer is Thermo Scientific’s latest model. Magnetic sector MS is not only rapid, but also precise, with the ability to display excellent precision over a wide range of concentrations.
Table 1 presents the Prima PRO mass spectrometer's performance specifications when measuring a complex gas mixture commonly used in the polyethylene manufacturing process.
The analysis cycle time is 10 seconds. Adding time for stream switching and purging, the overall cycle time for a multi-stream application is around 20 seconds per point.
Table 1. Prima PRO mass spectrometer performance specification for polyethylene process gases. Source: Thermo Fisher Scientific – Environmental and Process Monitoring Instruments
|
Polyethylene process stream |
|
Concentration mol% |
Standard deviation mol% |
| Hydrogen |
1 |
≤0.01 |
| Ethylene |
7 |
≤0.05 |
| Ethane |
1 |
≤0.01 |
| Nitrogen |
3 |
≤0.05 |
| n-butane |
1 |
≤0.05 |
| 1-butene |
0.75 |
≤0.01 |
| Isobutane |
Balance |
≤0.05 |
| 1-hexane |
0.5 |
≤0.005 |
| n-hexane |
0.2 |
≤0.005 |
Summary
Thermo Fisher's Prima Series Process Mass Spectrometer is an ideal instrument for monitoring process gases during catalyst development for polyolefin synthesis. When scaled up, this strategy is just as effective.
The Prima series MS generates data in just a few seconds per sample stream and with great precision. With the addition of a rapid multi-stream sampler (RMS), a single analyzer may be used on several reactors, making this a cost-effective system with low maintenance and operating costs.
Prima PRO mass spectrometers have been used in polyolefin development and manufacturing for some years. Users who have previously used GC for these measurements claim that MS analysis provides the following benefits:
- Polymer molecular weight dispersion is narrower and more symmetrical
- Improved control over comonomers leads to more consistent characteristics
- Reduced maintenance and simplified analytical operations
- Trials have excellent repeatability
- Reduced occurrence of unreliable trials
- Faster experimental data production
References and Further Reading
- Towards Chem & Materials (2025) Polyolefin market volume and forecast 2025 to 2034. Available at: https://www.towardschemandmaterials.com/insights/polyolefin-market.
Acknowledgments
Produced using materials originally written by Daniel Merriman and Dr. Robert Wright from Thermo Fisher Scientific.

This information has been sourced, reviewed, and adapted from materials provided by Thermo Fisher Scientific – Environmental and Process Monitoring Instruments.
For more information on this source, please visit Thermo Fisher Scientific – Environmental and Process Monitoring Instruments.