Ultraviolet-visible-near infrared (UV-Vis-NIR) microspectrophotometry (MSP) delivers objective, non-destructive, and highly discriminating spectral characterization of microscopic samples that the human eye cannot reliably differentiate.
Drawing from CRAIC Technologies’ application notes, this article synthesizes methodology and casework data across four forensic evidence classes: automotive/architectural paint, textile fibers, glass fragments, and questioned-document inks and papers.
Spectral measurements from the deep-ultraviolet (200 nm) to the near-infrared (1000 nm) range resolve chemical and colorimetric variations among samples that are visually or even microscopically indistinguishable. This includes paired fiber and paint exemplars, gel-pen inks from different manufacturers, and container glass from the same source.
The principles of transmission, reflectance, and fluorescence microspectroscopy are outlined, along with instrument calibration, sample mounting, and the colorimetric phenomenon of metamerism that motivates full spectral comparison rather than visual matching.
Representative case data for each evidence type demonstrate that UV-Vis-NIR MSP operates as a quick, minimally destructive technique well-suited for evidentiary work and compliant with Daubert-type admissibility criteria.
Background
In forensic investigations, trace evidence as small as a sliver of glass, a paint flake, a single fiber, or a handwriting fragment often proves crucial. For a trace evidence examiner, the primary objective is to establish or exclude a common source between a questioned sample and a known exemplar.
Historically, however, this comparison has depended on visual or low-power microscopic color assessment.1,6 This process is intrinsically subjective, influenced by factors such as the examiner's condition, ambient lighting, mounting media, and microscope optics.4,5
For more than four decades, optical microspectroscopy has been part of the forensic toolkit. Early instruments were limited to the visible region and were significantly light-limited; developments in optical design, illumination, computing, and array detectors have since enabled instruments to resolve spectral features from the deep ultraviolet through the near infrared and from sample regions down to 1 × 1 micron.1,6,8
Since MSP provides independent measurement of each wavelength intensity following calibration, instead of the eye's integrated three-channel response, it delivers a substantially more precise and repeatable basis for comparison compared to visual examination.1,2
This article synthesizes instrumentation, methodology, and case data covering four evidence classes for which UV-Vis-NIR MSP has become routine. Section 2 outlines shared instrumental and colorimetric principles; Section 3 details evidence-specific methodology and representative findings; Section 4 examines characteristics common to all four applications; and Section 5 concludes with a summary of the benefits of this method in forensic evaluations.
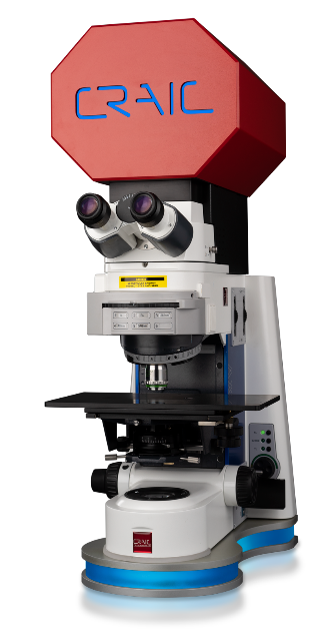
2030PV PRO™ UV-Visible-NIR microspectrophotometer. Image Credit: CRAIC Technologies
Instrumentation and Methodology
Instrument Configuration and Sample Handling
A UV-Vis-NIR microspectrophotometer integrates a custom-tailored UV-Vis-NIR microscope, a stabilized UV-Visible-NIR light source, a spectral dispersive component, a cooled array detector, and data-processing software.1,8 Contemporary systems (e.g., the CRAIC Technologies 2030PV PRO™ referenced throughout the underlying studies) employ a calibrated variable aperture as small as 1 × 1 micron, verified under live digital imaging prior to each acquisition.1,3,9
Paint chips are sectioned, either via microtome or manually for quick work, into approximately five-micron transmission sections; fibers are mounted flat between a slide and coverslip.1,4,5,6
While visible-only dye/pigment evaluation tolerates ordinary glass and media (Norland™ Optical Adhesive, XAM), complete UV-Vis-NIR characterization demands UV-transparent, non-fluorescent synthetic quartz (Suprasil™) slides with samples mounted in glycerin.1,6
Since glass fragments possess irregular and highly refractive properties (n ≈1.52) that distort directly obtained spectra, immersing the fragment in refractive-index-matched Cargille DF-series oil (n =1.515) within a quartz well slide suppresses these artifacts, and the refractive index calibrated oil doubles as the transmission reference.10
Document and ink evidence do not require preparation, allowing the item to be positioned directly on the stage while the aperture is optically aligned with incident illumination.6,7,9
Acquisition Modes, Calibration, and Colorimetry
Transmission microspectroscopy (light through a thin section) serves as the method of choice for UV work and weakly colored materials such as pale samples and clearcoats. Reflectance microspectroscopy (versus a reference standard) is ideal for inks on paper, opaque pigments, and irreplaceable opaque items (such as artworks). Fluorescence microspectroscopy delivers an independent and frequently highly discriminating comparison.
A good example is differentiating brightener emission from dye fluorescence in a fiber.1,6,7 Photometric and wavelength precision are validated using NIST-traceable standards, color references, and neutral-density filters.
Across the reviewed studies, standard parameters included approximately 10-micron apertures, 20–50-scan averaging, and multiple sampling locations per item to statistically account for dye and pigment variation within the samples.1,3,4,5,9,10
Absorbance, which follows the Beer–Lambert relationship (where absorbance is proportional to concentration), is typically favored for quantitative work; spectra can be further reduced to CIE tristimulus (X, Y, Z) and chromaticity (x, y) values.1
Importantly, distinct spectral curves can integrate to identical tristimulus values (metamerism), meaning that two samples that appear, or are even colorimetrically measured, to be identical can possess distinguishable underlying spectra. This serves as the main justification for why forensic casework requires full spectral comparisons instead of colorimetric or visual ones.1,2
Applications in Forensic Trace Evidence
Paint Evidence
Historically, micro-reflectometry was used to analyze unprepared paint chips. This method generated high-noise, artifact-prone spectra and could not characterize clearcoats (which often appear colorless to the eye).6,8 Contemporary practice instead sections the chip into a cross-section containing clearcoat, color-coat, and basecoat layers. Each layer can subsequently be measured individually in transmission.1,6,8
Since clearcoats contain UV-absorbing chemicals to protect the underlying pigment from photodegradation, they exhibit high absorbance below ≈400 nm despite contributing no visible color (Figure 1). A direct comparison between two automotive samples revealed significant differences in both the magnitude and shape of the clearcoat UV signatures, establishing clearcoat formulation itself as an independently discriminating feature.8
Fluorescence adds an independent comparison when layers fluoresce, and the same approach applies to fingernail polish and architectural or aircraft coatings.6
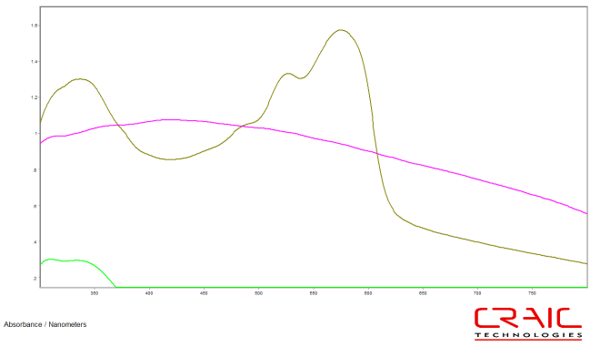
Figure 1. Absorbance spectra of an automotive paint chip's clearcoat (green), color layer (red), and basecoat (blue). The clearcoat is colorless in the visible region but absorbs strongly in the near-UV. Image Credit: Martin, P., et al. (2007) Microspectral Analysis of Colored Glass Fragments.1
Textile Fiber Evidence
Textile fibers transfer readily and are among the most common types of trace evidence.4 Pigments and dyes are characterized using visible-region MSP. Furthermore, UV-region MSP probes both the polymer substrate and additives, providing data that FTIR cannot offer, as FTIR identifies only the polymer and remains blind to colorants.5
A notable case study shows that one known and one questioned green wool fiber could not be distinguished under a comparison microscope. However, transmission MSP (300–850 nm) resolved clear differences: the known fiber exhibited peak absorbance at 328 nm (shoulder 382 nm) as well as a single visible peak at 635 nm, whereas the questioned fiber showed a shifted UV peak at 323 nm (shoulder 407 nm), and its visible peak split into two, at 603 and 646 nm, conclusively excluding a match despite visual identity.4
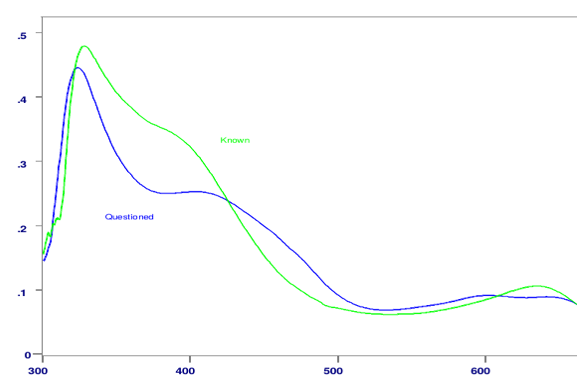
Figure 2. Absorbance spectra of known (green) and questioned (blue) green wool fibers. UV peak position, shoulder position, and visible-region peak structure clearly differ despite matching visual appearance. Image Credit: Martin, P. (2003)4
Broader surveys across nearly indistinguishable blue-black fibers, as well as reds, golds, grays, browns, and greens, verified that visually similar fiber pairs consistently resolve into distinguishable spectra when evaluated across the full UV-Vis-NIR range. Samples that appear identical to the human eye could be distinguished by peak position, shoulder structure, and relative intensity.3,5
Since most fiber dyes and pigments exhibit minimal absorbance above approximately 800 nm, the near infrared offers comparatively little additional discrimination for this evidence type, though more research in this area is needed.5
Glass Evidence
Glass fragments found at crime scenes possess essentially arbitrary shapes. Approximately 90% of commercial glass is soda-lime glass, a material that incorporates silica for structure, sodium carbonate to decrease melting point, and calcium/magnesium/aluminum oxides to enhance durability.
Additionally, intentional colorants, such as iron oxide and chromium, are responsible for the vivid colors observed in containers.10 Because irregular, highly refractive (n ≈1.5) fragments distort directly acquired spectra, a validated protocol immerses each fragment in refractive index-matched Cargille oil inside a quartz well slide.
This approach largely suppresses refraction artifacts while utilizing the oil itself as the transmission reference and examines glass evidence using three complementary approaches: refractive index (oil-immersion/hot-stage), elemental composition (SEM-EDS, 30 keV), and micro-color evaluation (UV-Vis MSP, 380–750 nm), each sampled at 20–30 locations per fragment.10
In a validation study evaluating eight container-glass samples (wine, gin, and Sauvignon Blanc bottles), mean refractive index clustered according to bottle type (Table 1), and normalized MSP absorbance overlays shared a blue-region maximum near 432–449 nm across all samples.
However, they were clearly separated by the relative intensity of a red-region feature (peaks near 635, 658, and 689 nm). The gin bottle samples exhibited significantly higher red-region absorbance than any wine bottle glass, whereas the two Charles Shaw wine bottles were essentially superimposable, consistent with a common manufacturing source.10
Table 1. Refractive index and MSP red-region peak data for eight container-glass samples. Source: Martin, P., et al. (2007)10
| Sample |
Mean RI |
Red-region peaks (nm) |
| Beringer Cabernet Sauvignon |
1.5225 |
635 / 658 / 689 |
| Charles Shaw Red (#1, #2) |
1.5240 |
635 / 658 / 689 |
| Tanqueray Gin (#1, #2) |
1.5248 |
635 / 658 / 689 |
| Sauvignon Blanc (Corbett Cyn., Geyser Pk.) |
1.5190 |
- |
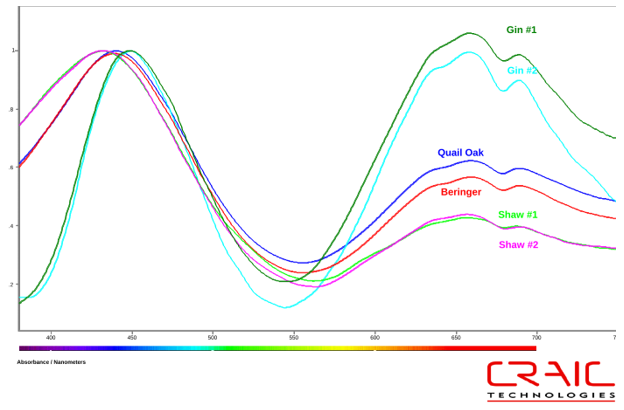
Figure 3. Normalized absorbance overlay of eight container-glass samples. All share a blue-region maximum near 430–450 nm, but red-region shoulder intensity (≈630–690 nm) separates gin-bottle glass from wine-bottle glass. Image Credit: Martin, P., et al. (2007)10
Refractive index and SEM-EDS remain the higher-discrimination methods for glass. MSP does not replace either method, functioning instead as a rapid, cost-effective screening step for colored samples.
Because it necessitates no preparation beyond immersion, is non-destructive, and requires just several spectra per fragment, this technique prioritizes samples for subsequent assessment or provides independent corroboration of RI/elemental conclusions.10
Questioned Documents and Ink Evidence
Gel ink, which suspends pigments and dyes in a water-based, largely insoluble polymeric gel, resists the spot tests and chromatography traditionally employed for ink comparison.9 Use of a calibrated variable aperture enables alignment of the sampling spot directly on a written line, under live imaging, for acquisition of a spectrum without removing material.6,7,9
Reflectance microspectroscopy, employing the paper substrate as the reference, is the most common mode, though transmission and fluorescence microspectroscopy are also available on the same platform when needed for other sample types.6,7
Two visually identical red gel inks from distinct pen models exhibited a shared overall spectral shape, yet remained distinguishable in Q-band and Soret-band position.6,7 A survey evaluating eleven blue gel-pen inks from six manufacturers (Zebra, Bic, Pentel, Pilot, and Uniball) demonstrated that even visually indistinguishable inks could typically be resolved spectrally.
Certain models sharing a common formulation, such as the two Pentel Energel variants, as well as the Uniball Gel Impact and Signo Gel Grip, generated near-superimposable spectra consistent with common sourcing.
Conversely, other inks of similar visible color, including the Pentel Sunburst, exhibited significant differences (Figure 4).9 Black gel inks followed the same pattern: while two Pilot Precise variants overlaid almost perfectly, the visually similar Pilot G-2 was readily differentiated by its highly distinct profile.7
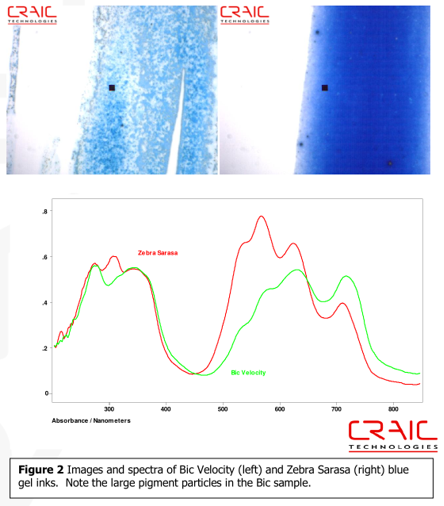
Figure 4. Photomicrographs and absorbance spectra of Bic Velocity and Zebra Sarasa blue gel inks. The black square marks the sampling aperture; despite both inks appearing blue, their UV/visible peak structure differs substantially. Image Credit: Martin, P. (2004)9
Gel-pen colorants tend to be complex, multi-component mixtures, and their resulting spectra are rich in discriminating features. The pattern across red, blue, and black gel inks supports two conclusions: close spectral agreement can identify common formulations across nominally different pen models, and full-spectrum comparison can reliably separate visually indistinguishable inks with distinct formulations.9
Discussion: A Unified Analytical Platform
Across all four evidence categories, three properties recur. First, objectivity: spectral comparison eliminates subjectivity dependent on the examiner, lighting, and instrumentation while directly addressing metamerism.1,2,4,5 Second, sensitivity beyond human vision: decisive discriminating features repeatedly fell below 400 nm or above 700 nm, areas inaccessible to the unassisted eye but routinely resolved using a contemporary MSP.3,4,5
Third, minimal-to-no sample consumption: transmission work on paint and fiber requires only thin sectioning or simple mounting, while reflectance work on documents does not require any at all. Furthermore, refractive-index-matched immersion now allows non-destructive measurement of even irregular glass fragments.1,6,7,10
The microspectrophotometer supports transmission, reflectance, fluorescence, and Raman microspectroscopy in a single platform. Equipped with digital imaging and calibrated variable apertures, the instrument allows examiners to move smoothly between evidence types and modes, boosting the discriminatory power attainable from one non-destructive assessment.6,7
Rigorous NIST-traceable calibration and reproducible, quantitative data support the dependability of conclusions under Daubert-type admissibility criteria.1,3,4,5,7
Nonetheless, MSP has limitations: for glass evidence, it lacks both the elemental specificity of SEM-EDS and the refractive-index precision of oil-immersion techniques. The molecular detail of Raman microspectroscopy can be integrated into contemporary MSP systems such as the 2030PV PRO™.
As demonstrated by the glass case study, the highest discriminatory power was achieved by combining MSP with refractive index and elemental data, rather than relying on any single technique alone.10
Conclusion
Over more than 40 years of applied development, UV-Vis-NIR microspectrophotometry has evolved from a light-starved, visible-only method into a submicron, multimodal analytical platform spanning deep UV to near-infrared.
Across paint, textile fiber, glass, and ink/document evidence, this system consistently resolves samples that are visually and microscopically indistinguishable, while demanding minimal sample preparation and preserving the evidentiary item for confirmatory evaluation.
The ongoing development of reference spectral databases and combined-technique protocols, such as those shown in this paper for glass and gel-pen inks, further increases the evidentiary value of UV-Vis-NIR MSP in forensic labs.
References and Further Reading
- Martin, P. Color Analysis of Paint by Microspectrophotometry. CRAIC Technologies application note, San Dimas, CA (referencing the SWGMAT Standard Guide for Microspectrophotometry and Color Measurement in Forensic Paint Analysis)
- Martin, P. (2008). Understanding Color and Microspectra. CRAIC Technologies, San Dimas, CA
- Koyama, E. (2012). Determining UV-VIS-NIR Spectral Response of Fibers. CRAIC Technologies, Inc., San Dimas, CA
- Martin, P. (2003). Differentiation of Two Visually Identical Samples by Microspectroscopy: Green Wool Fibers. CRAIC Technologies, San Dimas, CA
- Martin, P. (2003). Dye Analysis in Textile Fibers by Colorimetric Microspectroscopy. CRAIC Technologies, San Dimas, CA
- Martin, P. (2004). Forensic Applications of Ultraviolet-Visible-Near Microspectroscopy. CRAIC Technologies, San Dimas, CA
- Martin, P. (2004). Applications of Ultraviolet-Visible-Near IR Microspectroscopy to Questioned Documents. CRAIC Technologies, San Dimas, CA (cf. ASTM E1422-91, Standard Guide for Forensic Writing Ink Comparisons)
- Martin, P. (2003). UV-Visible Microspectroscopy of Clearcoats and Pigments of Automotive Paints. CRAIC Technologies, San Dimas, CA
- Martin, P. (2004). Ultraviolet-Visible-Near Infrared Microspectral Characteristics of Blue Gel Inks. CRAIC Technologies, San Dimas, CA (cf. Gernandt, M.N. & Urlab, J.J. (1996), An Introduction to the Gel Pen, J. Forensic Sci., 41(3), 503–504)
- Martin, P., Eyring, M., & Hoang, J. (2007). Microspectral Analysis of Colored Glass Fragments. CRAIC Technologies / Micro Forensics Ltd. / Arizona Department of Public Safety

This information has been sourced, reviewed, and adapted from materials provided by CRAIC Technologies.
For more information on this source, please visit CRAIC Technologies.