When asked how much characterization data their lab has created in the last five years, a polymer scientist responds, "an enormous amount." Ask them to pull every sample above a certain molecular weight that also exhibited a specific glass transition and observe what occurs. The data exists. It just cannot be questioned.
The Richness That Gets Lost
Polymer characterization is unusually rich, but this richness is precisely what is lost. A single material may go through GPC/SEC for molecular weight distribution (MWD), DSC for glass transition (Tg), melting (Tm), and crystallization (Tc), TGA for thermal stability and filler content, DMA and rheology for viscoelastic behavior, FTIR or NMR for composition and end groups, and tensile, impact, and hardness for mechanical performance. Six instruments, six software packages, six file types, and a single substance.
The curve is rarely preserved in the lab's shared record. It is a number entered into a spreadsheet: "Tg = 78 °C."
The thermogram from which the value was derived, the heating rate, the second-heat-vs-first-heat decision, and the operator's notation about a shoulder on the peak are all either stuck in the instrument or screenshotted and forgotten.
Most systems save the stated value but not the evidence supporting it. A flattened number cannot be re-baselined, re-integrated, compared to a new sample's entire curve, or easily justified six months later when no one recalls how it was obtained.
What a Single Number Leaves Out
When a measurement is reduced to one cell in a spreadsheet, the loss extends beyond resolution. It may eliminate information that the team will need later.
A DSC result of "Tg = 78 °C" reduces the shape of the transition: the width of the glass transition, the step shift in heat capacity, any enthalpy-relaxation peak from physical aging, and the melting and crystallization activity (Tm, Tc, and the enthalpies that provide percent crystallinity).
It also removes the conditions that make the figure meaningful: the heating rate and whether it was from the first or second heat. Two laboratories reporting "78 °C" using different methods do not report the same thing.
These are condition parameters, which modify the result rather than simply describe it. A Tg or Tm value varies with heating and cooling pace, whereas a tensile or modulus value varies with test temperature, which is why the same grade is frequently pulled at many temperatures.
A number recorded without its conditions cannot be accurately compared to one measured in another method. A platform designed for this retains the conditions, heating and cooling rates, test temperature, and procedure associated with each result, ensuring that the comparison remains valid years later.
GPC results provided as a single Mw are even slimmer. The full molecular weight distribution, dispersity, Mn, a high-molecular-weight shoulder, and a low-molecular-weight tail predict melt flow, brittleness, and processability. A bimodal and a narrow distribution can have the same Mw yet act very differently.
Scientists realize the importance of this context. The challenge is that many technologies used to capture results do not save them in a reusable format. Keep the curve, technique, and context with the resulting number, and the measurement will be interpretable for the next person who needs it.
What it Costs You on a Tuesday
The consequences become apparent in everyday situations. You locate three previous grades that should work; however, their DSC data were collected on two different instruments using different procedures, so the Tg values aren't directly comparable, and the raw files are missing.
A customer requests the molecular weight distribution for a 2023 specification; the value is on the spec sheet, but the chromatogram is on a defunct laptop.
Because there is no way to determine that history, a new hire runs GPC on a material that has already been described twice by the lab. In many labs, looking for previous work still entails opening folders labeled PE-graft-trial-final-v3 or contacting the individual who produced them.
Cabot: When the Data Lands Ready to Use
Cabot's performance-materials R&D includes rubber, elastomers, battery materials, and inkjet dispersions; the labs can create thousands of data points every day.
Cabot cut the time from completing a test to getting results into a scientist's hands by more than half by wiring instruments directly into the platform, with over 75 instrument integrations and test data streaming in automatically. In the elastomers lab, a service request that used to take six hours to enter manually now takes roughly three.
The time saved is important, but so is the quality of the recording. Data arrives structured and tied to its sample, allowing it to be used immediately rather than after being transcribed and reconciled.
As Lab Manager Michelle Shea put it: “Now we have instruments feeding directly into Uncountable.”
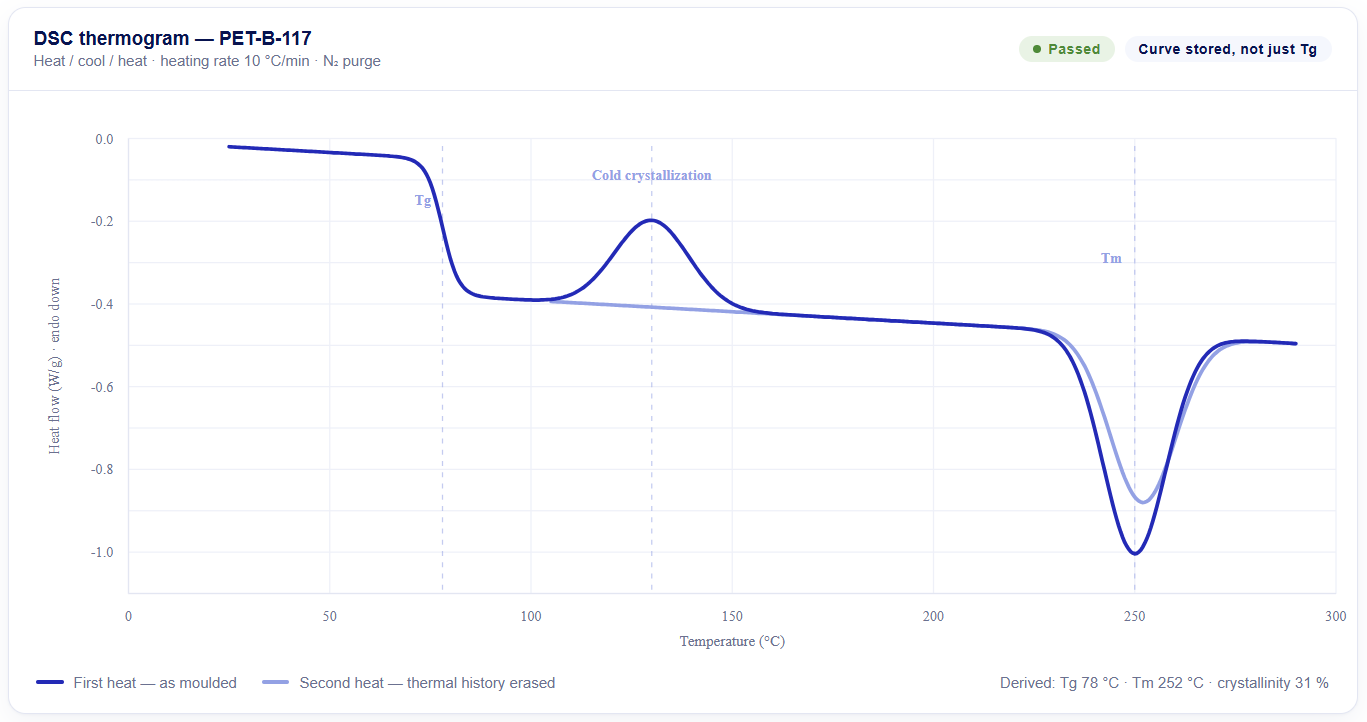
The evidence and the answer in one place; the curve is kept, not flattened to a single number. DSC heating rate: 10 °C/min. Image Credit: Uncountable Inc.
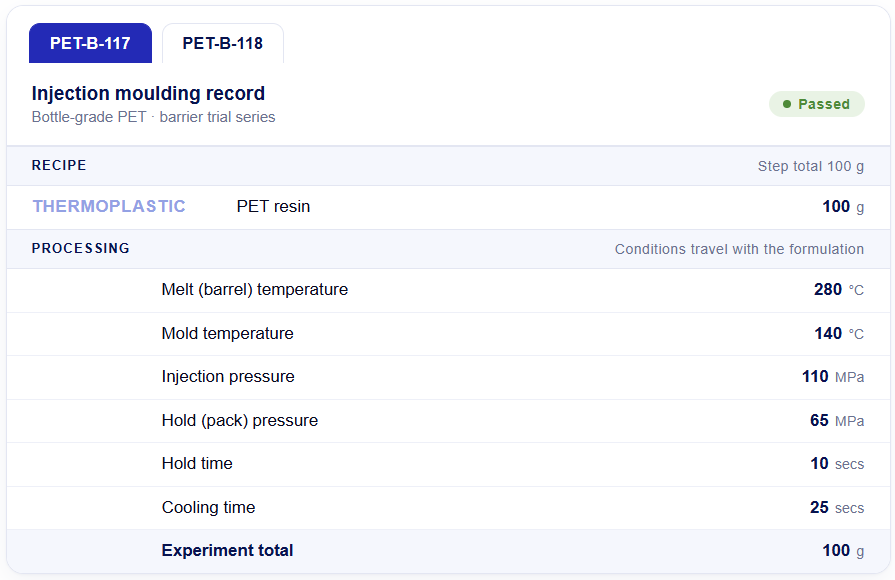
Composition and process conditions sit on one record, so the result stays interpretable later. Image Credit: Uncountable Inc.
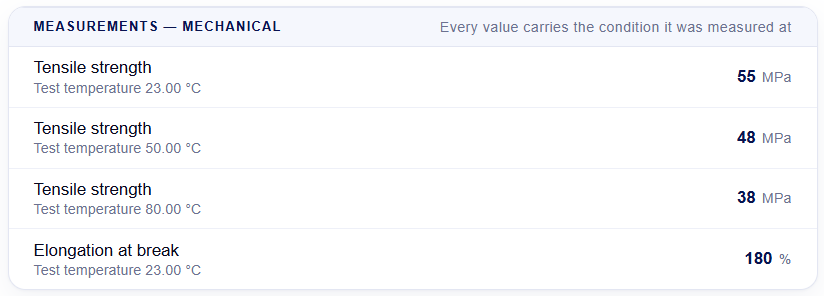
A number without its test temperature cannot honestly be compared to one measured another way. Image Credit: Uncountable Inc.
From Flattened to Connected
A better spreadsheet will not address the root issue. The whole characterization result must stay linked to the formulation that generated it and be queryable as data, rather than being saved merely as a screenshot.
Source: Uncountable Inc.
| Today (flattened) |
Structured & connected |
| “Tg = 78 °C” typed into a spreadsheet |
The DSC thermogram preserved with method, heating rate, and the reported Tg derived from it |
| GPC trace stuck in instrument software |
Molecular weight distribution stored as data, searchable by Mn/Mw/Ð |
| FTIR spectra screenshotted into slides |
Spectra co-located with the sample, comparable across samples |
| Search by file name and memory |
Search by content: all samples, Mw 50-80 k, Tg below 60 °C, passed elongation |
| Results disconnected from the recipe |
Every result linked to the exact formulation and process that made it |
When characterization data is maintained as evidence rather than as a summary number, everyday questions can finally be answered: show every sample with this thermal signature; examine these five spectra; and which formulations produced this MWD.
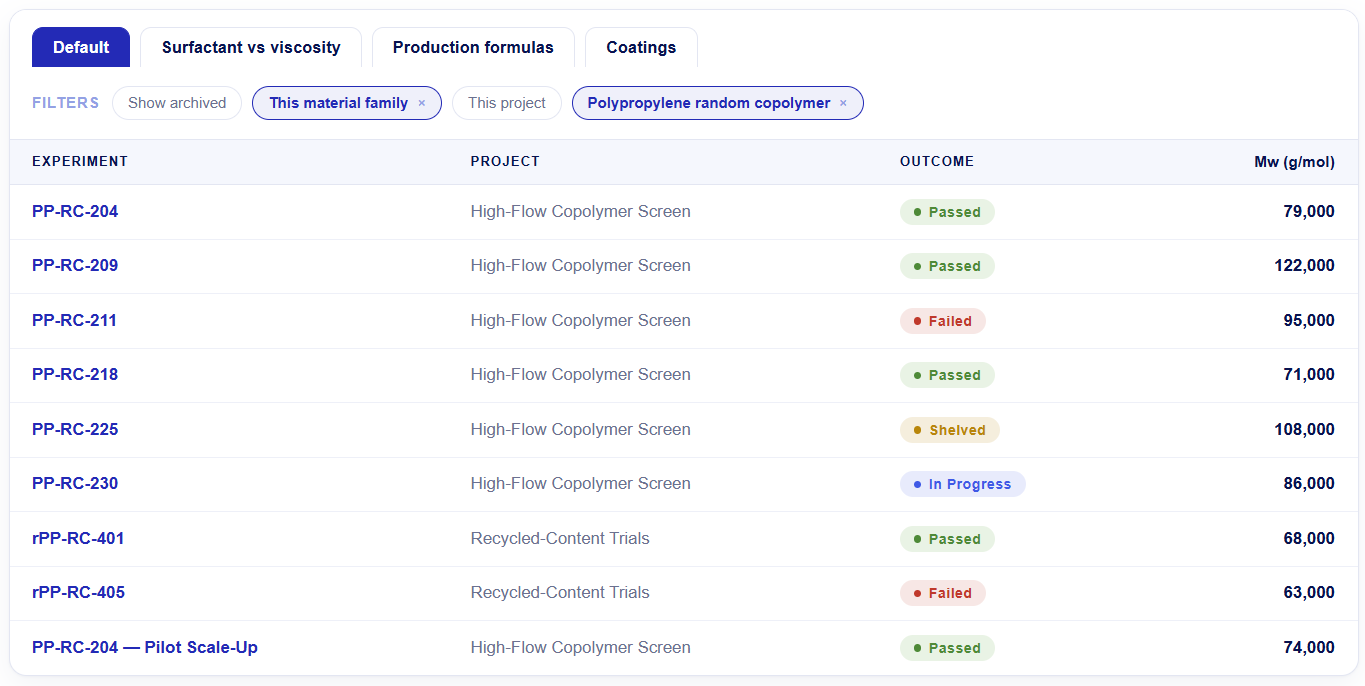
Search by what the data contains, not by who named the file. Image Credit: Uncountable Inc.
In Conclusion
The richness of polymer characterization becomes useful only when the data is available for future use.
A thermogram reduced to a single number is considerably more difficult to repurpose, reinterpret, or defend later. Preserve the thermogram, its approach, and its relationship to the formulation, and the results will allow for comparison, reintegration, and technical assessment months later.
The goal is not to generate additional data. It is to preserve the value of data that the lab has previously produced. When the curve, technique, and formulation are all connected, a characterization result becomes long-term R&D knowledge rather than a test that must be repeated to answer a common question.
Acknowledgements
Noel Hollingsworth, CEO, Uncountable

This information has been sourced, reviewed, and adapted from materials provided by Uncountable Inc.
For more information on this source, please visit Uncountable Inc.