Plastic masterbatches are extremely concentrated additive formulations utilized across the plastics sector that function as key raw materials for functionalizing or coloring polymer products, including flame retardancy, anti-aging performance and further distinct characteristics.
They are manufactured by combining, melting, and pelletizing high concentrations of filler additives or pigments with a polymer carrier. Masterbatches are normally classed into filler masterbatches, color masterbatches, and additive masterbatches, according to their planned application.
For masterbatches, particle morphology and size are the two most essential quality indicators. The base resin and particle size must be compatible to guarantee uniform dispersion and melting throughout processing. If not, defects like color inconsistency, crystal points, and streaking can happen.
Adequate flowability and stable morphology are also crucial, as poorly formed or irregular particles may lead to incorrect dosing in automatic processing equipment, along with blockages and feeding problems.
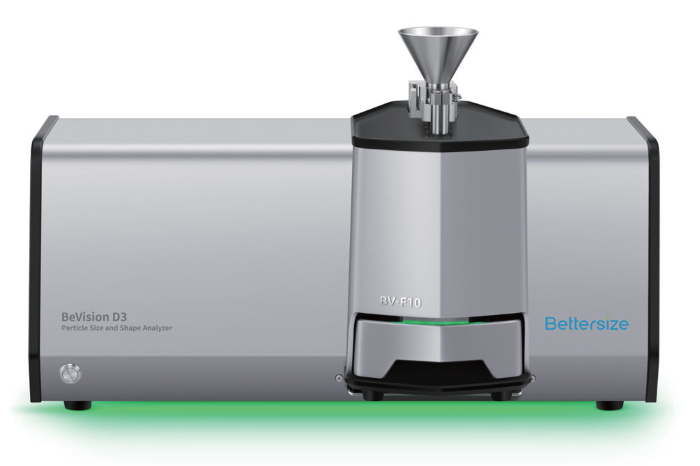
Image Credit: Bettersize Instruments
Instruments and Methods
Fitted with the BV-F10 free fall dispersion unit, the BeVision D3 dynamic image particle size and shape analyzer was utilized to determine morphological data and the particle size distribution (PSD) of polyethylene terephthalate (PET) masterbatch samples.
Table 1. BeVision D3 Test Configuration. Source: Bettersize Instruments
| Dispersion method |
Free fall |
| Imaging |
5-megapixel CMOS |
| Feeding control |
Automatic |
| Number of particles measured |
7,000 pcs |
| Test duration |
4 mins |
Results and Discussion
Analysis of Particle Size
The area-equivalent diameter XA was chosen as the key metric for determining the particle size of PET masterbatch. Shown in Figure 1, the area-equivalent diameter XA refers to the diameter of a circle whose projected area (A) equals that of the particle.
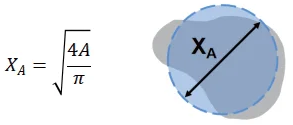
Figure 1. Definition of Area-Equivalent Diameter XA. Image Credit: Bettersize Instruments
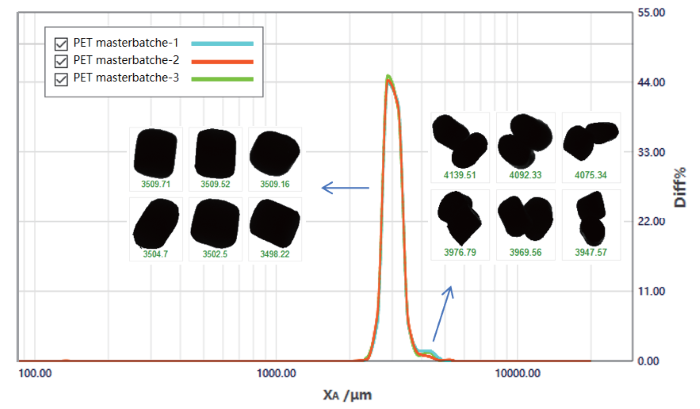
Figure 2. Particle size distribution curve of PET masterbatch samples. Image Credit: Bettersize Instruments
The PET masterbatch samples’ particle size distribution (PSD) curve is shown in Figure 2. The distribution is bimodal, with a minor secondary agglomeration peak observed at the coarse end.
Image observation verifies that particles bigger than 4000 μm are largely adhered particles. The collection of false agglomerates was avoided throughout the investigation due to the BeVision D3’s automatic feeding-speed control that successfully reduced particle overlap and crowding.
The coarse peak represents actual adhered particles found in the sample. As shown in Table 2, the three consecutive measurements all have repeatability values less than 0.3%, proving superior stability.
Table 2. Repeatability of three measurements. Source: Bettersize Instruments
| Parameter |
PET-1 |
PET-2 |
PET-3 |
Average |
St. dev. |
Repeatability |
| D10 |
2811.18 µm |
2797.10 µm |
2798.71 µm |
2802.33 µm |
7.70 µm |
0.27% |
| D50 |
3072.43 µm |
3063.62 µm |
3063.34 µm |
3066.46 µm |
5.17 µm |
0.17% |
| D90 |
3371.30 µm |
3355.33 µm |
3352.54 µm |
3359.72 µm |
10.12 µm |
0.30% |
Characterization of Impurities and Adhered Particles
Figures 3 to 5 display characteristic images of adhered particles (XA > 3700 μm), standard particles (2000 μm < XA < 3700 μm), and impurity particles (XA <700 μm) in order.
Due to the ability of the BeVision D3 to evaluate all particles and store images, impurity and adhered particles can be easily recognized and measured. Particles less than 700 μm are categorized as impurities while particles greater than 3700 μm are classed as adhered clusters or pairs.
As displayed in Table 3, 2.14% of the total particle volume comprises of adhered particles (XA > 3700 μm), while impurities (XA ≤ 700 μm), represent 0.01%.
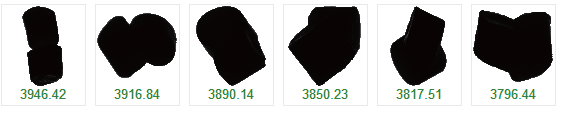
Figure 3. Adhered particles (XA > 3700 μm). Image Credit: Bettersize Instruments
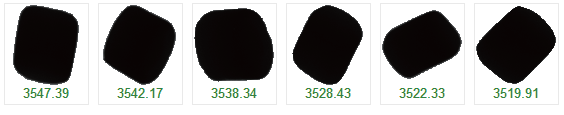
Figure 4. Normal particles (2000 μm < XA < 3700 μm). Image Credit: Bettersize Instruments
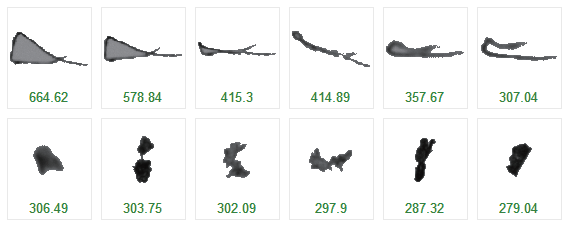
Figure 5. Impurity particles(XA < 700 μm). Image Credit: Bettersize Instruments
Table 3. Volume-weighted proportion of impurity and adhered particles. Source: Bettersize Instruments
| . |
. |
| Q(xA > 3700.00 μm) |
2.14% |
| Q(xA ≤ 700 μm) |
0.01% |
These calculations offer simple proof of a very low level of small impurities and the existence of oversized adhered particles, facilitating more precise process enhancement and QC regulation.
Conclusion
The BeVision D3 effectively analyzed 7,000 PET masterbatch particles in only four minutes utilizing dynamic image analysis technology, providing fast and highly productive characterization. With three consecutive calculations reaching a repeatability greater than 0.5%, the particle size distribution showed outstanding consistency.
Particle overlap and crowding were successfully reduced by the BeVision D3’s automatic feeding-speed control, ensuring that no false adhered particles were produced during the investigation.
Small impurity particles and adhered particles can be simply observed and precisely measured with complete particle image categorization and capture. This feature enables transparent image-supported evidence for quality control and helps manufacturers to evaluate the stability of production, notice processing challenges early, and confidently improve product quality.
Acknowledgments
Produced from materials originally authored by Echo Cao and Weichen Gan from Bettersize Instruments Ltd.

This information has been sourced, reviewed and adapted from materials provided by Bettersize Instruments.
For more information on this source, please visit Bettersize Instruments.