Polyethylene terephthalate (PET) is a versatile polyester widely used in bottles, fibers, films, and engineering materials. PET grades differ primarily by molecular weight. For example, textile-grade PET features a lower molecular weight, with its intrinsic viscosity (IV) typically between 0.64 and 0.68 dL/g, corresponding to around 20 to 30 kDa.
In contrast, chip- or bottle-grade PET has a higher molecular weight, with its intrinsic viscosity (IV) generally in the range of 0.7 to 1.0 dL/g and its weight-average molecular weight (Mw) typically 30 to 60 kDa or higher.
These values and differences are important because molecular weight directly affects both processing behavior and mechanical strength.
Intrinsic viscosity provides an average value, but it does not reflect the full molecular-weight distribution. The use of a combination of Size Exclusion Chromatography (SEC) and light-scattering detection is key to process control and product optimization, as this approach enables direct measurement of absolute molecular weight and detailed distribution analysis.
Experimental
The study presented here used an SEC system equipped with light-scattering (LS) and refractive index (RI) detectors. The light scattering detector fitted in the BeSEC LS2 from Bettersize Instruments can accommodate 90 ° and 7 ° angles, while the BeSEC workstation is able to integrate light scattering with RI or UV signals to calculate molecular weight averages (Mn, Mw, and Mz) and distributions.
System Configuration
The system configuration employed was as follows:
- Detectors: Light Scattering (LS) + Refractive Index (RI)
- Column: Shodex GPC KF-806M
- Mobile phase: Hexafluoroisopropanol (HFIP)
- Flow rate: 0.7 mL per minute
- Injection volume: 100 μL
- Column temperature: 40 °C
- dn/dc: 0.296 mL/g
Sample Preparation
A total of three PET samples were analyzed during this study. Each powder was accurately weighed and dissolved in HFIP to achieve a concentration of 2 to 7 mg/mL. It was stirred until clear, then filtered through a 0.22 μm PTFE syringe filter and transferred to vials for autosampler injection.
Results and Discussion
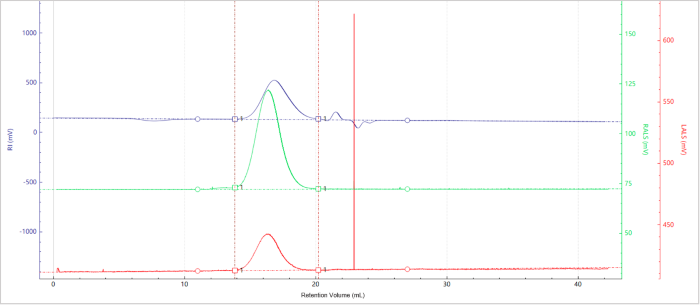
Figure 1. Elution profiles of the multi-detector signals for Sample A. Image Credit: Bettersize Instruments
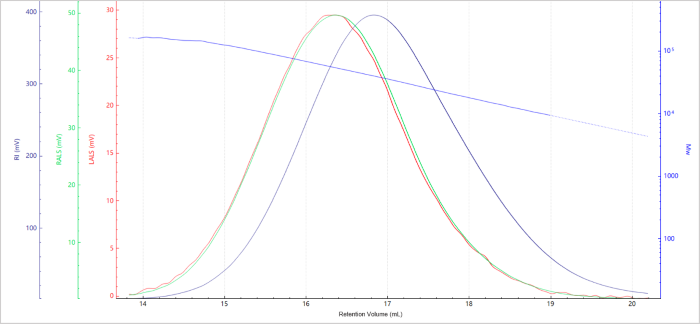
Figure 2. Elution profile of the molecular weight for Sample A. Image Credit: Bettersize Instruments
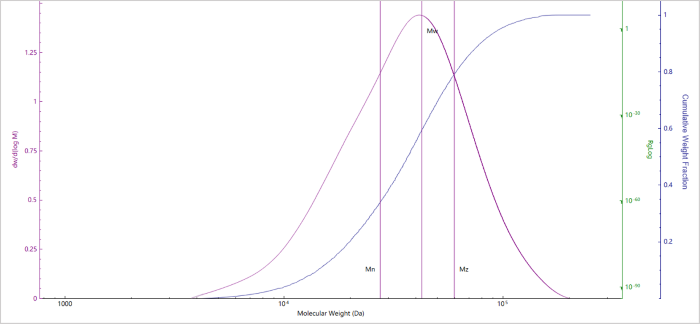
Figure 3. Molecular weight distribution of Sample A. Image Credit: Bettersize Instruments
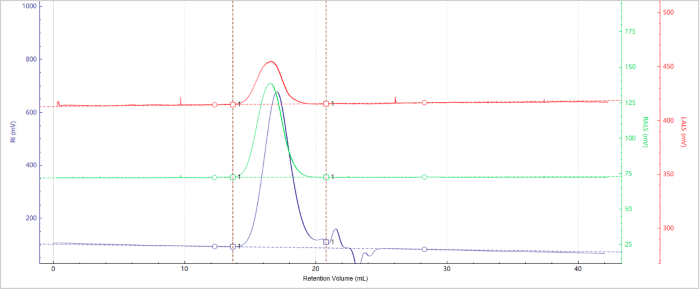
Figure 4. Elution profiles of the multi-detector signals for Sample B. Image Credit: Bettersize Instruments
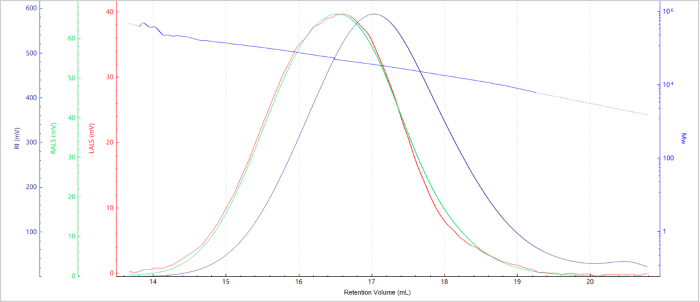
Figure 5. Elution profile of the molecular weight for Sample B. Image Credit: Bettersize Instruments
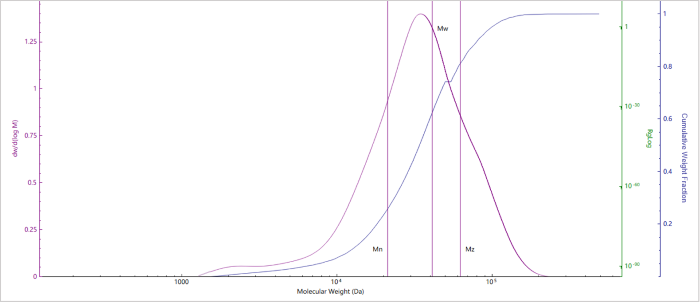
Figure 6. Molecular weight distribution of Sample B. Image Credit: Bettersize Instruments
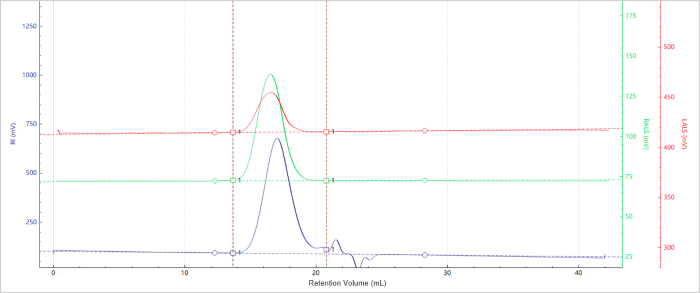
Figure 7. Elution profiles of the multi-detector signals for Sample C. Image Credit: Bettersize Instruments
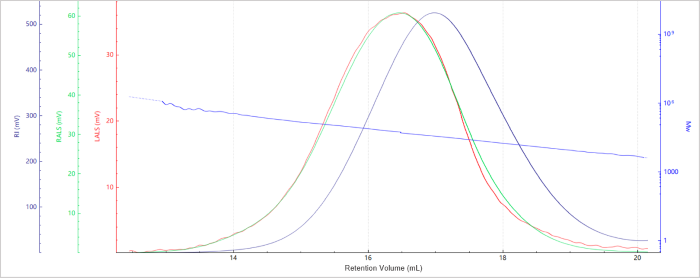
Figure 8. Elution profile of the molecular weight for Sample C. Image Credit: Bettersize Instruments
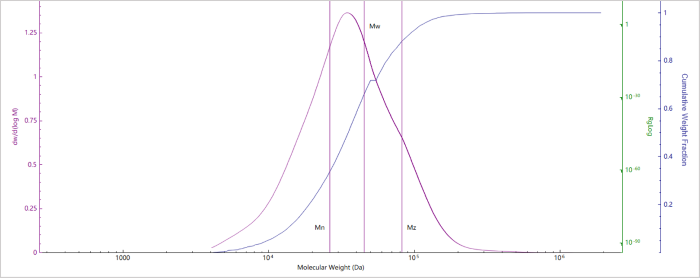
Figure 9. Molecular weight distribution of Sample C Image Credit: Bettersize Instruments
Figures 1-9 present chromatograms, molecular weight elution profiles, and distribution plots for the three analyzed PET samples.
In the case of Figures 1, 4, and 7:
- The blue trace represents the RI signal
- The green trace represents the right-angle light scattering (RALS) signal
- The red trace represents the low-angle light scattering (LALS) signal
Figures 2, 5, and 8 feature chromatograms with molecular weight profiles. The blue line represents the molecular weight as a function of elution time in this case.
Figures 3, 6, and 9 show the differential and cumulative molecular weight distributions of the analyzed samples.
The chromatograms show clean baselines, strong signal-to-noise ratios, and minimal noise. It was also noted that molecular weight profiles gradually decreased with elution volume. This was determined to be consistent with SEC principles, in which larger chains elute first, followed by smaller chains.
Scattering peaks showed no tailing, and molecular weight curves remained stable at the end, verifying that effective size-based separation had occurred.
Source: Bettersize Instruments
| No. |
Mn (Da) |
Mw (Da) |
Mz (Da) |
Mw/Mn |
| Sample A |
27,594 |
42,463 |
59,631 |
1.53 |
| Sample B |
21,274 |
41,191 |
62,620 |
1.93 |
| Sample C |
26,112 |
42,411 |
68,615 |
1.62 |
Table 1 summarizes the acquired molecular weight data. All three samples were found to exhibit weight-average molecular weights above 40 kDa, meeting the requirement for bottle-grade PET.
Sample B shows a broader distribution (Mw/Mn ≈ 2), indicating a higher proportion of low-molecular-weight species.
Conclusion
Employing the BeSEC LS2 with light-scattering detection yielded accurate molecular-weight characterization of PET samples.
All three samples analyzed met bottle-grade specifications, demonstrating clean, stable chromatographic profiles and detector signals well aligned.
The capacity to resolve molecular weight distribution provides useful insight for PET grade selection and quality control.
Acknowledgments
Produced from materials originally authored by Zhibin Guo from Bettersize Instruments.

This information has been sourced, reviewed and adapted from materials provided by Bettersize Instruments.
For more information on this source, please visit Bettersize Instruments.