Manufactured sand (M-Sand) performance is mainly ruled by two critical quality standards: particle size distribution (PSD) and particle morphology. A well-designed PSD enhances particle packing, creating lower permeability, higher compressive strength, and lower shrinkage cracking in concrete structures.
The angular structure and coarse texture of M-Sand particles increase cement bonding, producing greater compressive and flexural strength. In comparison, the permanent durability of concrete can be significantly jeopardized by substantial quantities of flaky or needle-like particles.
Conventional sieving delivers exclusively one-dimensional PSD data and is unable to determine particle morphology. Due to this, manufactured samples of sand with comparable PSDs can still display highly different concrete performance when their shape attributes differ, especially when it comes to the quantity of flaky, elongated, or needle-like particles.
Dynamic image analysis technology solves this challenge by utilizing contactless high-speed imaging to offer both complete morphological characterization and high-resolution PSD information, involving precise measurement of needle-like particle content.
PSD sieve-based analysis is time-intensive, non-automatic, and necessitates test sieves to be constantly maintained. BeVision D3’s automated dynamic image analysis provides a more efficient, quicker replacement, with completely automated characterization workflows and limited maintenance needs.
This investigation shows a total measurement of the morphological characteristics and PSD of manufactured sand (M-Sand) utilizing the BeVision D3 and contrasts the resulting data with those acquired using the conventional sieving technique.
Instruments and Methods
Coupled with the BV-F10 Free Fall dispersion unit, the BeVision D3 dynamic image particle size and shape analyzer was utilized to assess the morphology and PSD of M-Sand. Sieve analysis was performed as a comparison with a vibrating sieve analyzer fitted with Tyler standard sieves.
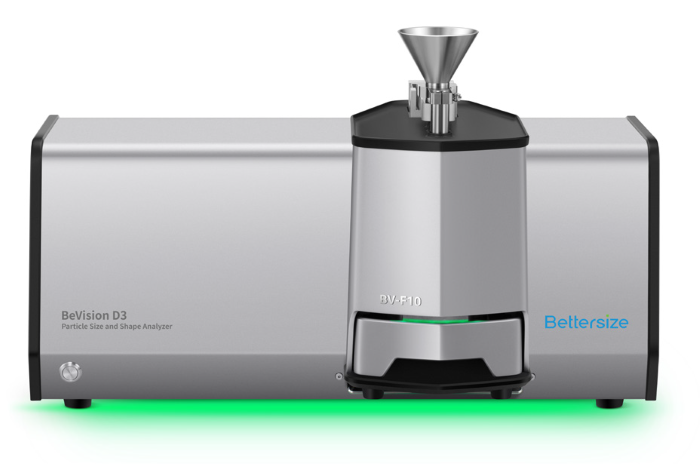
Image Credit: Bettersize Instruments
Table 1. BeVision D3 Test configuration. Source: Bettersize Instruments
| Dispersion method |
Free fall |
| Imaging system |
5-megapixel CMOS |
| Feeding control |
Automatic |
| Number of particles measured |
100,000 pcs |
| Test duration |
2 min |
Results and Discussion
Particle Size Analysis
The PSD curves displayed in Figure 1 were acquired using three particle size metrics: area-equivalent diameter (XA), minimum Feret diameter (XFmin), and minimum chord length (XCmin). These curves portray a consistent order where XA > XFmin > XCmin.
This ordering happens as anisotropic materials like sand give various observed particle sizes according to the way the measurement is specified.
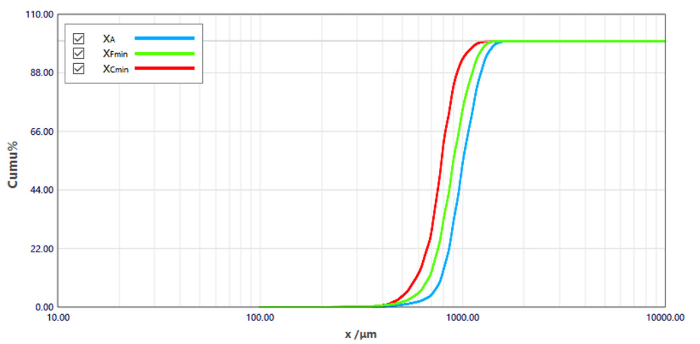
Figure 1. PSD curves of three different particle size parameters. Image Credit: Bettersize Instruments
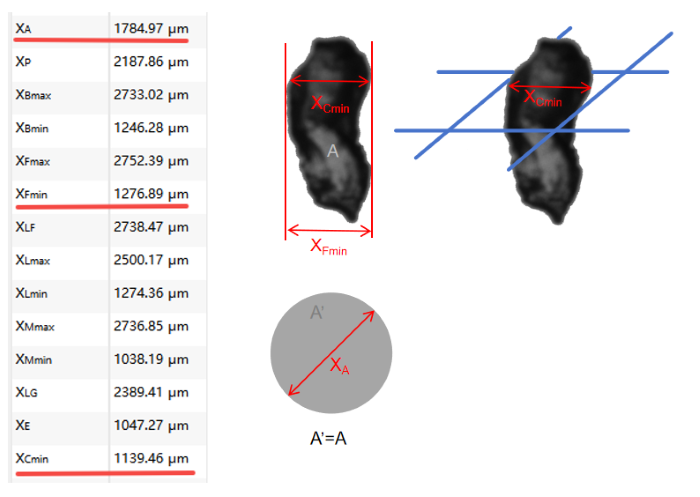
Figure 2. Comparison of particle size parameters. Image Credit: Bettersize Instruments
Figure 2 shows the conceptual variations across the three parameters:
- Area-equivalent diameter (XA): Signifies a circle’s diameter with an identical projected area to the particle projection.
- Minimum Feret diameter (XFmin): Comparable to calculating the smallest dimension of a particle using a caliper, this refers to the narrowest distance between two parallel tangents.
- Minimum chord length (XCmin): Determined utilizing a technique that models the way particles orient and filter through sieve openings throughout mechanical vibration. Because of this, XCmin most strongly resembles sieve behavior.
XFmin can closely align with sieve results for smooth particles or spherical particles. XCmin corresponds more strongly to true sieve analysis as it represents depressions and surface curvature in the case of angular or irregular particles.
The relationship amongst particle size metrics in short is XA > XFmin > XCmin ≈ Sieve.
This formula is particularly useful for irregular materials where shape strongly impacts the observed PSD, such as in manufactured sand.
Sieve Correlation
Along with utilizing XCmin as a particle size metric, the BeVision software provides an in-built feature for sieve correlation, which enables PSD measurements to be directly translated into sieve-equivalent results. This offers easy comparison, and even substitution, of image-based PSD results for conventional sieve information.
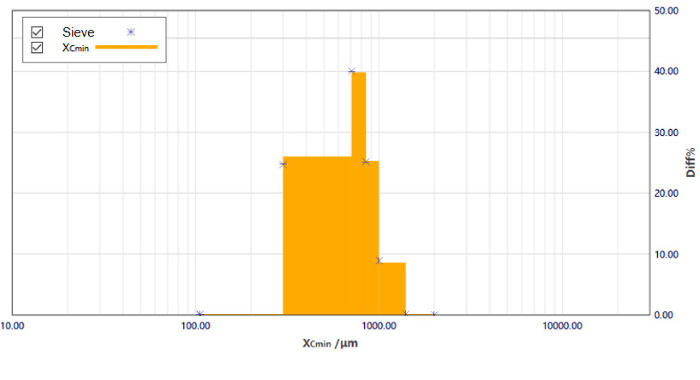
Figure 3. The PSD histogram ( Sieve) from BeVision D3. Image Credit: Bettersize Instruments
Table 2. The PSD measured by the sieve analyzer. Source: Bettersize Instruments
| Mesh |
Size /µm |
Percentage /% |
| 10 |
2000 |
0 |
| 14 |
1400 |
0.16 |
| 18 |
1000 |
8.90 |
| 20 |
850 |
25.08 |
| 25 |
710 |
40.03 |
| 50 |
300 |
24.78 |
| 140 |
106 |
0.05 |
| Pan |
0 |
0 |
Table 3. The PSD measured by the BeVision D3. Source: Bettersize Instruments
| XCmin /µm |
Diff /% |
| 2000.00 |
0.00 |
| 1400.00 |
0.16 |
| 1000.00 |
8.61 |
| 850.00 |
25.32 |
| 710.00 |
39.85 |
| 300.00 |
26.03 |
| 106.00 |
0.03 |
| 0.00 |
0.00 |
A strong correlation between the two techniques across all size classes is clearly shown in the comparison. Users who depend on conventional sieving at present can change to the BeVision D3 with no need to alter current acceptance standards or quality control (QC) thresholds, while gaining much better testing efficacy.
Particle Shape Measurement
An essential morphological metric for evaluating the shape of a particle is the aspect ratio. It is known as the ratio of the minimum Feret diameter to the maximum Feret diameter of the projection of a particle, as displayed in Figure 4.
An aspect ratio value closer to 1 suggests a more equiaxed shape, while a value approaching zero suggests that the particle is more needle-like.
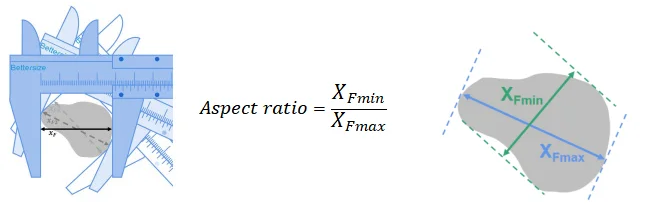
Figure 4. Aspect ratio definition. Image Credit: Bettersize Instruments
High-Quality Particles (Aspect Ratio > 0.45)
Particles that have an aspect ratio exceeding 0.45 have comparatively blocky shapes and offer a stable granular skeleton inside concrete. They are well-suited for making high-strength concrete and bond successfully with cement paste. Instances of these high-grade particles are presented in Figure 5.
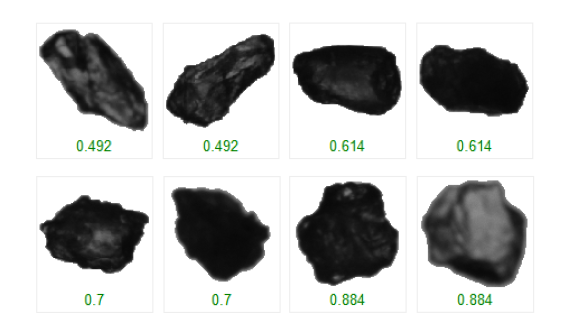
Figure 5. High-quality particles. Image Credit: Bettersize Instruments
Needle-Like Particles (Aspect Ratio ≤ 0.45)
Particles with an aspect ratio below this margin are classed as flaky or needle-like. Their extended shapes reduce concrete flowability, adversely influence long-term mechanical performance and raise water demand. These particles need to be closely observed in manufacturing sand (M-Sand). Figure 6 displays examples of needle-like particles.
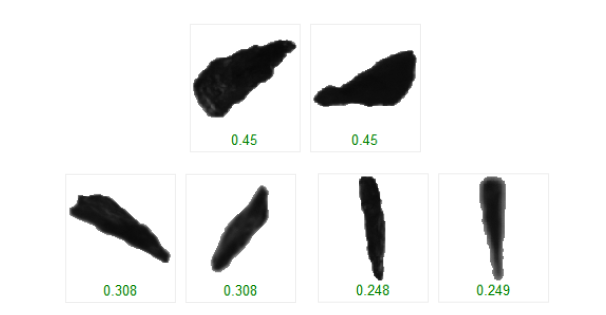
Figure 6. Needle-like particles. Image Credit: Bettersize Instruments
Stone Powder (Size < 75 μm)
Stone powder is the category for particles less than 75 μm. Although limited quantities can be used to fill voids, concrete workability can be decreased when excessive amounts are prevalent, which raises the water demand while contributing little to the end product’s long-term strength. Figure 7 demonstrates some examples.

Figure 7. Stone powder. Image Credit: Bettersize Instruments
Needle-Like Particle Distribution
Figure 8 plots aspect ratio compared to each analyzed particle to portray shape distribution. Every point denotes a distinct grain of sand. A definite size-shape correlation is observed in the results. Particles bigger than 1000 μm normally have aspect ratios of more than 0.45, representing shapes of high quality.
Particles less than 1000 μm contain a higher quantity of needle-like particles, with the majority falling beneath the 0.45 aspect-ratio margin. This shift mirrors the organic breakage process of sand throughout processing and crushing.
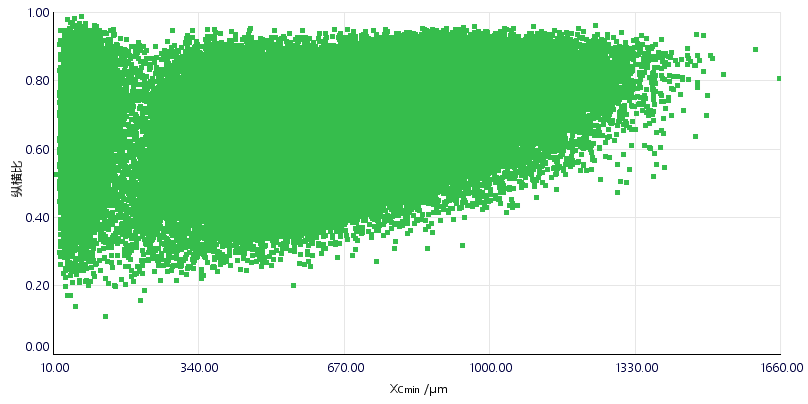
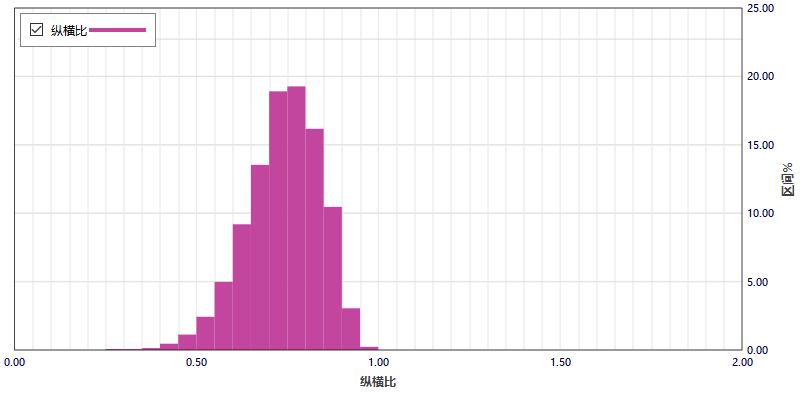
Figure 8. Aspect ratio distribution (Top: aspect ratio vs. particle size; Bottom: aspect ratio distribution). Image Credit: Bettersize Instruments
Table 4. Volume-weighted quantities of stone powder and needle-like particles. Source: Bettersize Instruments
| . |
. |
| Q(Aspect ratio ≤ 0.450) |
0.65% |
| Q(XCmin ≤ 75.00 μm) |
0.02% |
The data conveys that the sample includes 0.02% of stone powder and only 0.65% of needle-like particles, suggesting that the overall quality of the sand is superb with a reduced quantity of unwanted particle classes.
Conclusion
In two minutes, the BeVision D3 automatically characterized 100,000 manufactured sand (M-Sand) particles, providing significantly high throughput in contrast to conventional sieving analysis, which routinely takes approximately 30 minutes for sample testing, preparation, and cleaning the sieve.
Along with its higher efficiency, the BeVision D3 needs almost no maintenance, further decreasing resource drain. The PSD results acquired utilizing BeVision D3’s dynamic image analysis presented strong alignment with results created through vibrating sieves.
This strong correlation enables users who presently depend on sieve-based PSD analysis to easily change to the BeVision D3 with no need to alter current QC standards, while decreasing labor costs and significantly improving measurement efficiency.
In addition to PSD, the BeVision D3 delivers concurrent high-resolution particle size and shape analysis, together with the full capture of particle images. This function provides a comprehensive assessment of manufactured sand quality, covering stone powder fraction and the quantity of needle-like particles, from both morphology and size aspects.
This detailed information enables successful improvements in aggregate production procedures, dependable quality control, and enhanced forecasting of concrete performance.
Acknowledgments
Produced from materials originally authored by Echo Cao and Weichen Gan from Bettersize Instruments Ltd.

This information has been sourced, reviewed and adapted from materials provided by Bettersize Instruments.
For more information on this source, please visit Bettersize Instruments.