Often, users running powder tests are presented with a wide range of potential tests, from which they must determine the order in which to run them, what their numbers mean, and what to do about the data.
This approach favors experienced users. It offers far less support to a formulation scientist encountering an unfamiliar ingredient, or to a process engineer attempting to establish why a hopper blocks intermittently rather than consistently.
For this reason, a different workflow has been developed for the powder flow analyzer: a fixed initial sequence, software that interprets the resulting data and explains its significance, and a defined next step at every stage. The user does not need to select the correct test in advance; they simply need to understand how the powder is likely to behave.
How the Exponent Connect Software Works
Step 1: Run the Three PFA Tests in One Project
Cohesion, PFSD, and caking are carried out consecutively on a single sample, requiring approximately 18 minutes of walk-away time. The sequence has been designed deliberately: the least disruptive measurement is performed first and the most disruptive last, ensuring that each stage remains representative of the original material.
The sequence produces nine parameters: cohesion index, bridging factor, bulk density, speed sensitivity ratio, flow stability, cake height ratio, mean cake strength, cake strength, and column height ratio.
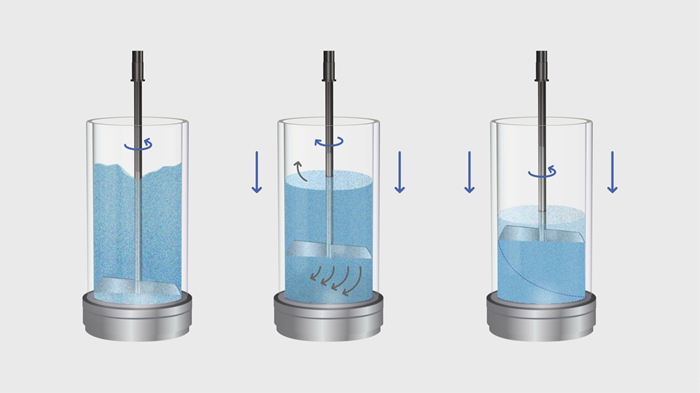
This three-in-one project joins together the cohesion test, PFSD test, and caking test. Image Credit: Stable Micro Systems Ltd
Step 2: Let the Results Come to You
A macro in Exponent Connect detects the completed results spreadsheet and opens the Results Interpreter, automatically loading the data. There is no need to enter, transfer, or recheck values manually, reducing the risk of error.
Step 3: Receive an Answer, Not a Spreadsheet
The interpreter first identifies the most important risk indicated by the data and explains it in straightforward language. It then presents the supporting detail:
- Each measurement is placed within a severity-coded band, with the numerical limits displayed alongside it
- Powder behavior is described separately in terms of cohesion, dynamic behavior, and caking
- Likely problem areas are ranked for filling, hopper discharge, and storage, with the parameters supporting each ranking clearly shown
- A recommended follow-up test is provided, together with the reason it is suggested based on the observed result pattern
All band boundaries and severity colors are explained within the tool, so users are not accepting interpretations without explanation.
Step 4: Put the Results in Context
A single value can be difficult to interpret in isolation. The Sample Comparator places two samples side by side, whether they are different batches, from alternative suppliers, or the same material before and after a process modification.
Alternatively, a sample can be compared with a reference powder from a library of well-characterized materials, showing how closely its behavior matches known performance.
Where This Fits in the Wider Test Range
These three tests provide an initial assessment rather than a complete characterization, and the interpreter reflects this by recommending a subsequent test with every result. Some recommendations involve additional powder flow analyzer measurements, including compressibility, consolidation and caking, or cohesion at four speeds.
Other recommendations transfer the same powder to the TA.XTplusC Texture Analyzer, where complementary methods can extend the assessment, for example: unconfined yield stress, relevant to hopper discharge, arching, and ratholing; vertical shear strength, used to inform hopper and bin design; granule compaction, which measures granule strength before tableting; and powder compaction, which assesses performance when the material is formed into a tablet, pellet, or compact.
In this way, the single-instrument platform can follow a powder from flow behavior through to finished-product performance.
Why This Matters
An isolated result is simply a number. It is not until a result is accompanied by interpretation that it becomes an answer. When that result is compared with a known reference, it becomes a decision that can be acted upon.
This applies equally to someone conducting their first powder flow analyzer test and to an experienced user with many years of practice.

This information has been sourced, reviewed, and adapted from materials provided by Stable Micro Systems Ltd.
For more information on this source, please visit Stable Micro Systems Ltd.