Oil and gas production depends considerably on understanding the main characteristics of reservoir rock, such as permeability, porosity and wettability. Geoscientists have created a number of approaches to measure these characteristics, for example, log and core analysis techniques.
Advantages of NMR
The key advantages of Nuclear Magnetic Resonance (NMR) spectroscopy are listed below:
- Low field nuclear magnetic resonance, NMR, is normally used in the oil exploration industry to determine the T2 relaxation time distribution of fluids in core plugs.
- These distributions can be explained to provide information on pore size distributions, porosity, permeability, free fluid index and bound water volumes.
- Devices used for regular measurements of relaxation distributions normally operate at 2MHz in order to minimize artefacts caused by ferromagnetic material in the samples and to match the functioning of the NMR logging tools.
- Laboratory-based devices are used to calibrate downhole logging tools for more accurate and advanced measurements on cores.
Instruments having a higher field capability are also available for use in applications where higher sensitivity is needed such as in imaging studies.
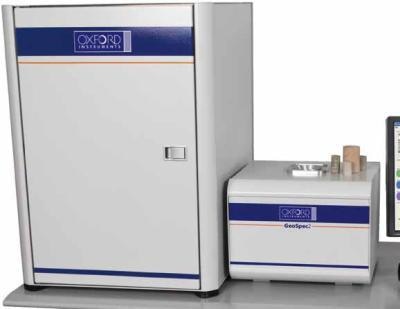
Geospec2 Rock Core Analyser
In order to visualize the fluids in small pores, the measurement parameter known as TE (Time to Echo) needs to be as short as possible. The Hitachi High-Tech Analytical Science GeoSpec2 rock core analyser acquires data with TE of just 90 ìs, which is considered the best available performance in the industry. This superior performance is due to the innovative Q-Sense enhanced proton sample probe. The probe ensures a considerable decrease in acquisition times and a simultaneous increase in signal to noise ratio.
Advantages of the Q-Sense Technology
The major advantages of the Q-Sense probe are listed below:
- Enhanced signal to noise for quicker analysis
- Enhanced sensitivity for measurements on low porosity rocks
- Shorter echo times to characterize tightly bound rocks
- Low susceptibility to probe detuning for convenient usage
- External power dissipation for minimized thermal effects
- Better power handling capability for better 180¨¬ pulses
- Built-in calibration feature for a higher accuracy over a wide range of conductive rocks
NMR Core Analysis Procedure
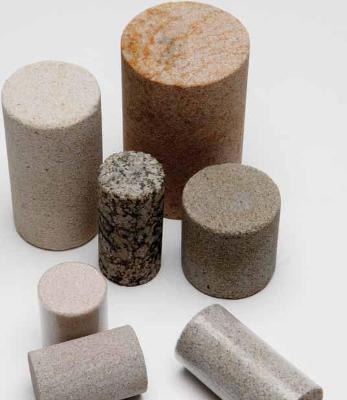
In a characteristic laboratory NMR core analysis procedure, a sample is scanned after it is completely saturated with one fluid such as oil or brine. A T2 distribution is obtained which represents the pore size distribution within the core sample. It is possible to detect tiny pores since the shorter the echo time enabled by the NMR instrument, the shorter the T2 that can be resolved. This holds significance in unconventional reservoirs, more particularly, in shale oil, gas and heavy oil reservoirs. In unconventional reservoirs, the tiny pores often contribute the most to the total porosity of the core samples, which is a major factor in determining the estimated output of any reservoir.
The GeoSpec2 instrument offers short echo time whereas previously measurements were taken using longer echo times. In that case, the total porosity and corresponding reservoir potential were undervalued.
Results
To show the performance of the GeoSpec2, data are compared on three different shale samples.
All scans were run with the following parameters:
- Recycle delay: 500 ms
- Gain 54 dB
- T2 Max: 100 ms
- Echo times: 100, 200 and 600 µs
Table 1 shows the results obtained at different echo times.
Table1. Results obtained at different echo times
| Sample |
TE (µs) (=2xTau) |
Acquisition Time (min) |
Number of Scans |
Signal to Noise Ratio |
NMR Volume (ml) |
| 1-1R |
100
|
1.5
|
64
|
203.72
|
4.512
|
|
200
|
7
|
272
|
201.74
|
1.983
|
|
600
|
32
|
1312
|
200.71
|
0.939
|
| 1-4R |
100
|
2
|
80
|
220.18
|
4.248
|
|
200
|
5.5
|
224
|
203.06
|
2.175
|
|
600
|
21.5
|
864
|
200.16
|
1.151
|
| 1-11R |
100
|
5
|
192
|
200.48
|
2.309
|
|
200
|
17
|
640
|
203.93
|
1.271
|
|
600
|
46
|
1840
|
200.81
|
0.754
|
Discussion
The results are discussed below:
- The results show that shorter TE times produce quicker measurements and detect more signal
- A significant amount of signal comes from short T2 relaxation times and thus smaller pores.
- Using the Green Imaging Technologies (GIT) Systems software, Figures 2 and 3 show the T2 pore size distribution curves obtained from the acquired T2 NMR data at various echo times for the three samples. This gives an indication of pore size distribution in the samples.
- In the figures, the green line represents T2 pore size distribution acquired at 100 µs echo spacing,
- The red line represents T2 pore size distribution acquired at 200 µs echo spacing
- The blue represents T2 pore size distribution acquired at 600 µs echo spacing.
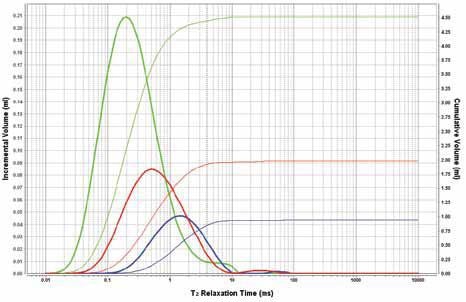
Figure 1. Sample 1-1R
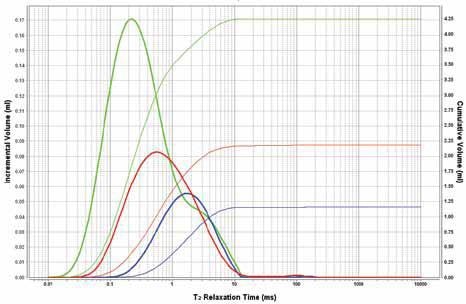
Figure 2. Sample 1-4R
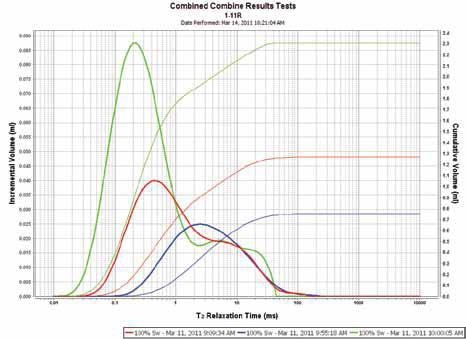
Figure 3. Sample 1-11R
It is clearly shown from the variation in the curves for the three samples that more signal is obtained at shorter echo times. In all the three graphs, the green line represents a considerably greater variance of volumes and is a better measure of the actual pore size distribution in the core sample. It will also provide a more precise porosity input for estimations of reservoir potential.
Conclusions
From the experiments, it is clear that shorter echo time measurements are extremely advantageous when determining total porosity and pore size distribution, as the difference in detected NMR volume for shorter echo times is greater by a factor of two or more. The shorter echo and acquisition time provided by the GeoSpec2 core analyzer and enhanced by the GIT Systems software, enables one of the fastest and most convenient ways to get an accurate pore size distribution and total porosity measurement of core samples. More accurate and timely data inputs make for a more comprehensive and timely reservoir model.

This information has been sourced, reviewed and adapted from materials provided by Oxford Instruments Magnetic Resonance.
For more information on this source, please visit Oxford Instruments Magnetic Resonance.