The performance of solar cells depends on a number of parameters such as film thickness, substrate texture, accurate contact finger formation and wafer edge quality. The Zeta-200 Automated 3D Measurement System offers true color analysis and imaging of complicated surface in less than 1 min for each site. The proprietary and innovative ZDot technology enables the measurement of almost all types of surfaces from highly smooth to highly rough.
Solar Cell Process Characterization
Texture Surface Area Ratio on Mono and Poly Silicon
Etching of pyramid structures is done on the wafer surface to improve solar cell light absorption, as displayed in the Zeta 3D image below (Fig. 1). Pyramids in the field of view are analyzed and counted with the sequence repeating itself on several sites across the wafer.
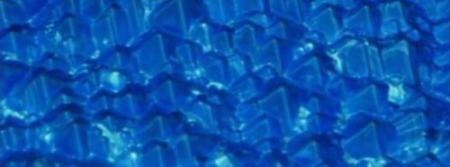
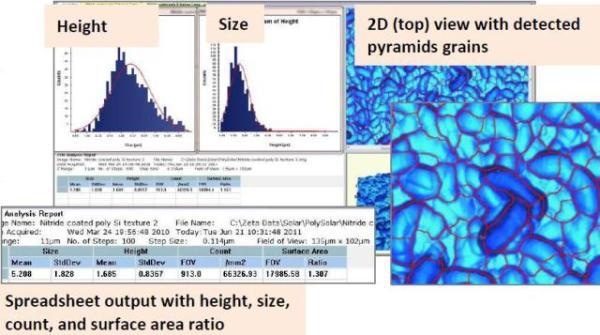
Figure 1. Zeta 3D image of pyramid structures on a wafer surface and corresponding analysis.
Film Thickness Measurement
Film thickness from 30 nm to 10 µm can be determined using a white light spectrometer, even on rough and textured silicon surfaces (Fig. 2).
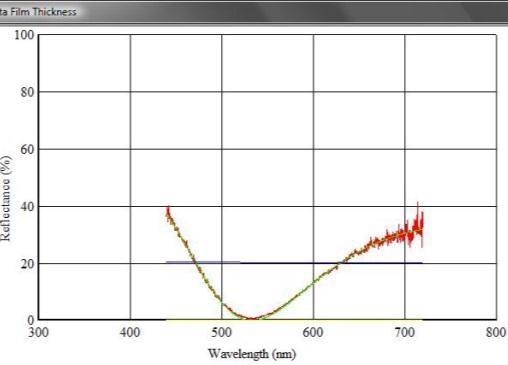
Figure 2. Determination of film thickness using a white light spectrometer.
Convenient Edge Inspection Module
In order to remove conductive areas from the wafer edge, etching or polishing processes are used; they can however can cause damage. A Zeta 3D image of a wafer edge is shown below (Fig. 3). Several cross sections of the wafer edge showing roughness and shape are shown at the right.
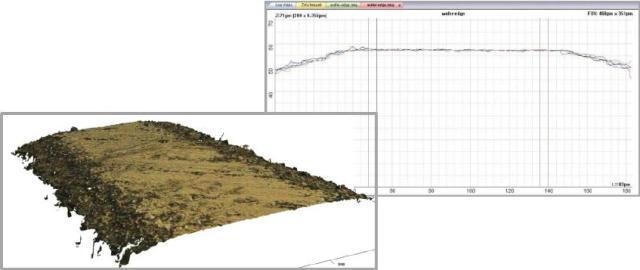
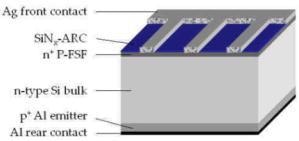
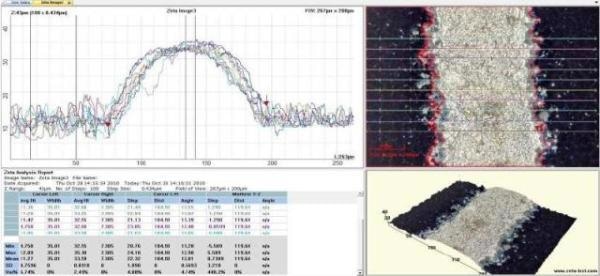
Figure 3. Zeta 3D image of a wafer edge and corresponding characterization.
Automated Contact Finger Detection and Inspection
The automation of the analysis of metal contact fingers using high-dynamic range imaging is enabled using the Zeta-200 system.
The features of high-dynamic range imaging are listed below:
- The auto-focus enables detection of the wafer surface.
- The pattern recognition enables determining the metal pattern and arranging the same at the image center.
- The recipe-defined scan parameters enable control of the vertical range and helps adjust the illumination to accommodate extremely low reflectivity (nitride-coated) and high-reflectivity (metal) surfaces.
- The analysis software determines automatically the height and width of various cross sections.
- Optional sequences repeat the measurement on sites across the wafer.
Zeta Solar Package
Zeta 3D Software examines standard 2D or 3D wafer images for general surface characterization that include the following:
- Surface roughness.
- Feature size, diameter, area and volume.
- Step height.
- Wafer bow.
- Film Thickness.
- 3D surface visualization in true color.
- Statistics.
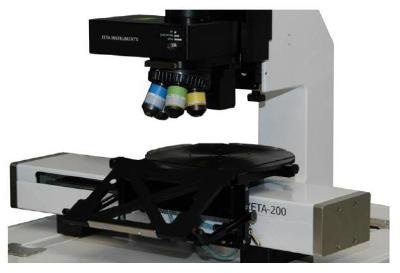
Figure 4. Zeta 200 system series (close-up).
Configuration
Several configurations of the system are available that include the following:
- Zeta-20 manual load system for R&D.
- Zeta-200 system with an automated XY stage.
- Optional edge measurement fixture.
- Optional film thickness measurement.
- Vacuum chucks for wafers of different sizes.
- Piezo stage for 2-nm height resolution.
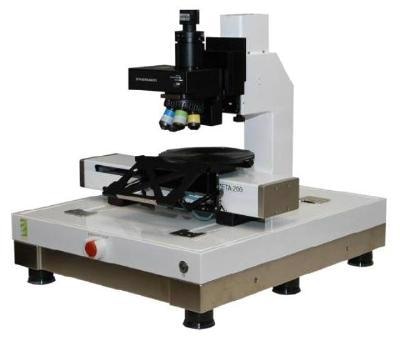
Figure 5. Zeta-200 system series.
Customized solar cell analysis software comprises production-ready recipes to enable substrate texture characterization and contact finger inspection.

This information has been sourced, reviewed and adapted from materials provided by KLA Corporation.
For more information on this source, please visit KLA Corporation.