In protein and peptide analysis, knowledge of the molecule's oligomeric state helps scientists determine whether the protein exists in its biologically active form. The first step in determining the oligomeric state is usually the separation of the molecular species and their characterization by size exclusion chromatography (SEC).
Ideally, SEC separates the molecules according to their hydrodynamic volume and determines molar masses by calibrating retention times against molecular standards of the same conformation and chemical composition as the molecules of interest. In many cases this is analysis is unsuccessful, either because relevant molecular standards are not available or because of non-ideal interactions between the analyte and column packing material. The coupling of SEC with light scattering overcomes this limitation and allows for absolute characterization of the molar mass and oligomeric state of the eluting macromolecules.
Multi-angle light scattering (MALS) is a first principles method for quantifying the molar mass of macromolecules in solution. This technique makes no assumptions about the molecule’s structure, and no molar mass standards are required. Previous studies have also shown the separation of insulin oligomers by SEC and detection by light scattering techniques1-2. In addition, composition-gradient MALS (CG-MALS) measurements have been used to determine the affinity and stochiometry of insulin association3-5. This article describes the impact of buffer composition and sample concentration on the oligomers of insulin identified by SEC coupled to MALS (SEC-MALS).
Instrumentation and Experimental Procedure
SEC was performed using an Agilent 1260 HPLC system coupled with an isocratic pump, an auto sampler and a degasser. GE Healthcare’s Superose 12 300/10 was used as the separation column.
An Agilent variable wavelength detector at 280nm, a DAWN® HELEOS® 18 angle light scattering detector, and an Optilab® rEX™ refractive index detector were used for the detection (Figure 1). Wyatt Technology’s ASTRA® software was used for the SEC-MALS analysis.
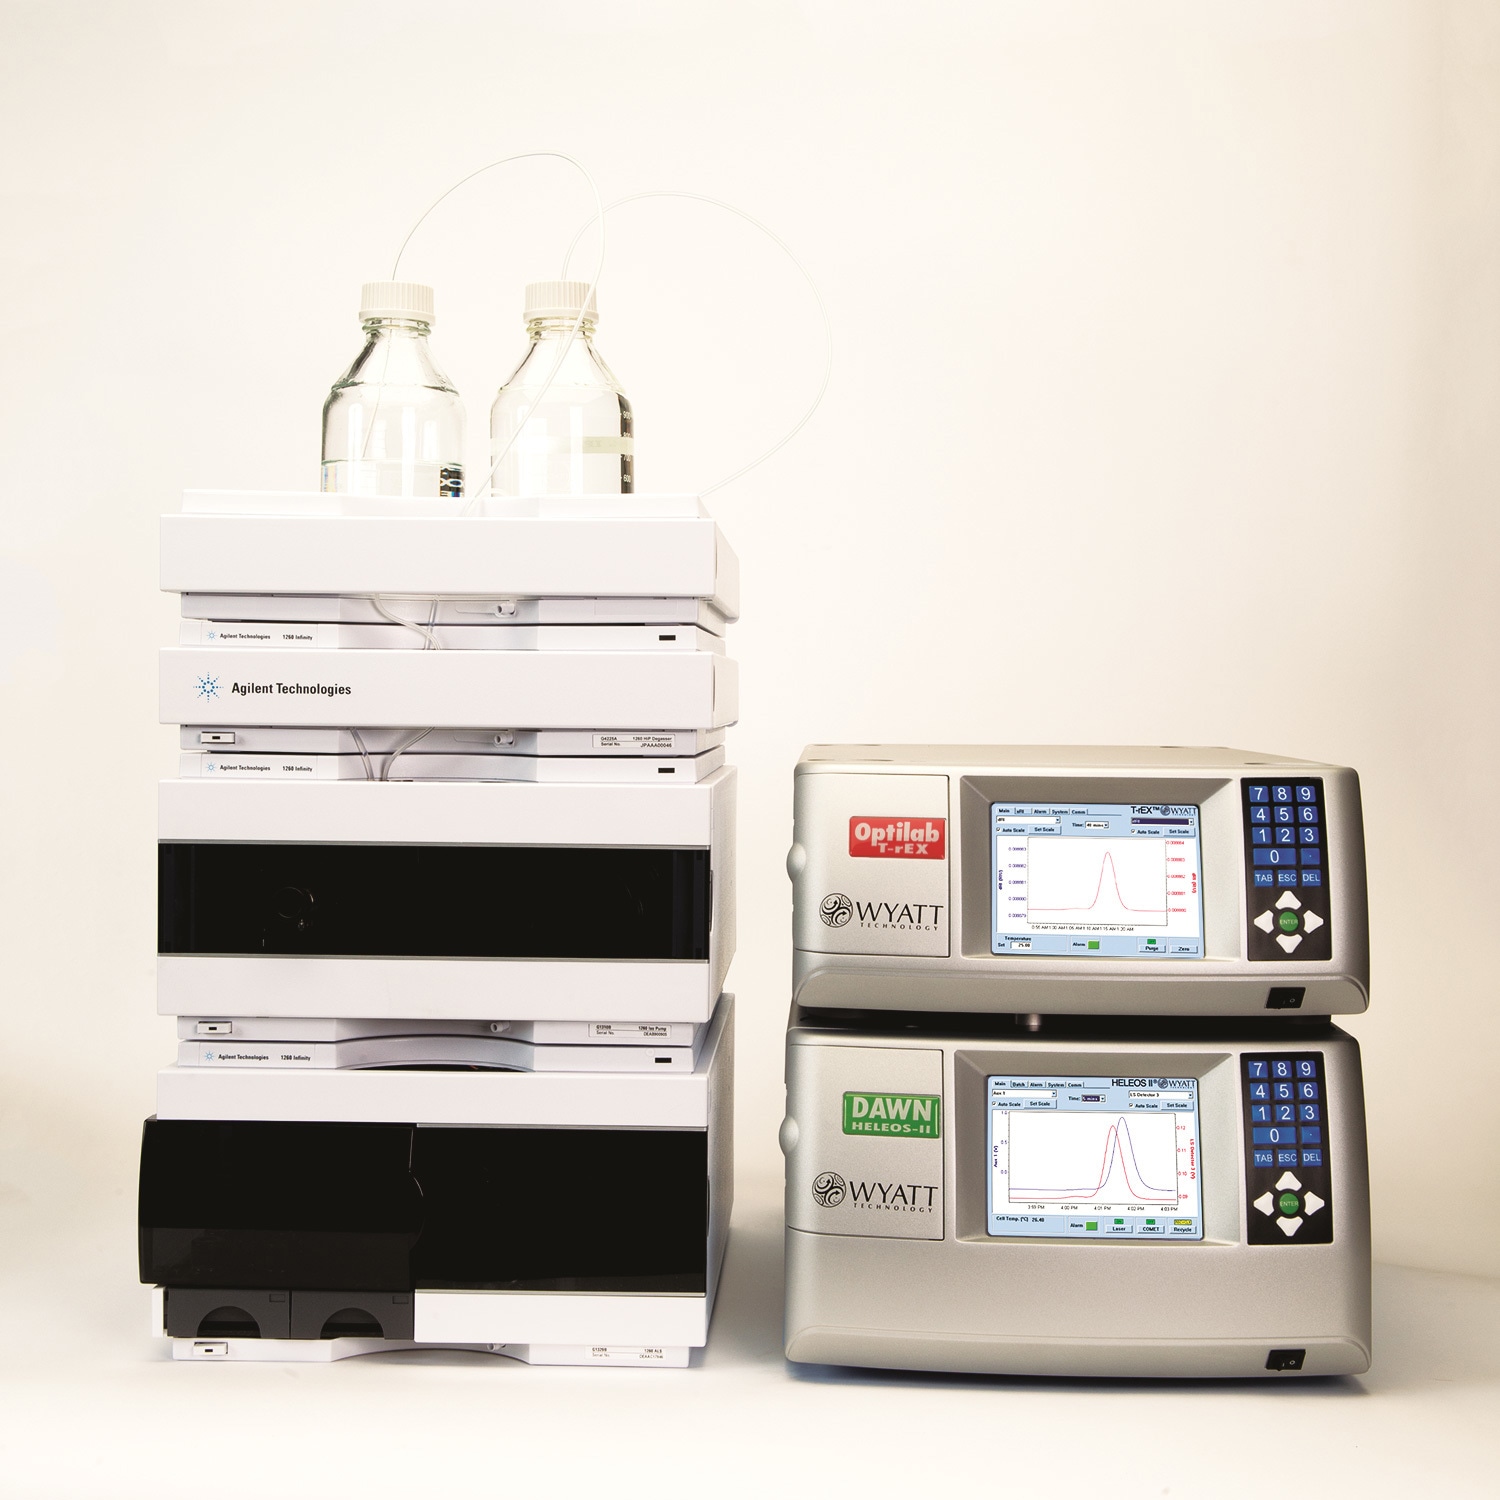
Figure 1. Instrumentation for the analysis.
The mobile phase comprised 140mM NaCl, 10mM Tris, 2mM phenol and 200ppm NaN3 at pH 7.7. Three different insulin sample preparations all containing 0.6 mM insulin were analyzed. Sample 1) insulin analogue without added zinc; Sample 2) human insulin with 0.1 mM zinc; and Sample 3) human insulin with 0.3 mM zinc.
Experimental Results
In the absence of zinc, insulin molecules form dimers and other oligomers, which can be separated by SEC and analyzed by light scattering. Figure 2 shows the results of sample 1 with molar masses represented throughout the chromatogram. The major fraction has a measured molar mass of 5.8 kDa and corresponds to the insulin monomer. This species is well resolved from the minor fraction corresponding to the hexamer with molar mass ~35 kDa. Moreover, the light scattering signal indicates that the measured molar mass for the secondary peak includes a range of oligomers from monomer to hexamer—a conclusion that could not be drawn from the UV signal alone. It should be emphasized that, because light scattering is extremely sensitive to high molecular-weight species, MALS identified the hexamer easily even though very little UV signal is present.
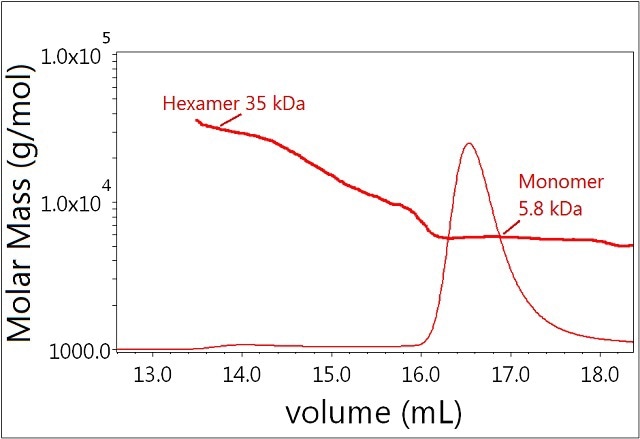
Figure 2. Plot of molar mass vs. time of sample 1. The UV signal at 280nm is plotted as an overlay. The molar masses were calculated using DRI and LS.
In contrast, the majority of Sample 2 (0.1 mM zinc) exists as a hexamer (Figure 3, blue), and a significant fraction appears to be undergoing monomer-dimer equilibrium. This lower molecular weight peak elutes slightly faster than the monomer peak for Sample 1, and the measured-molar mass is heterogeneous across the peak—spanning the masses of the monomer and dimer (~6-12 kDa).
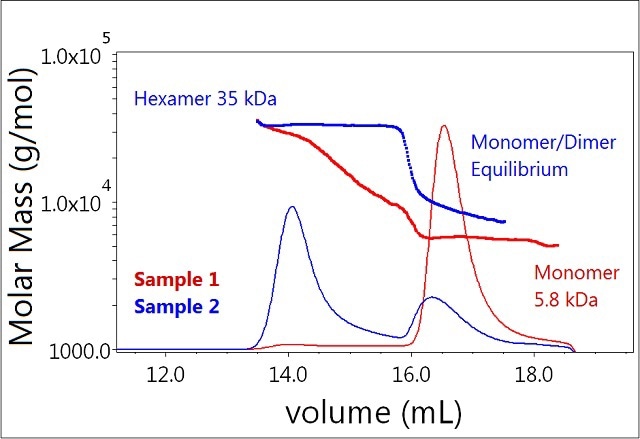
Figure 3. Plot of molar mass vs. time of sample 1 and 2 (mono-mer, dimer, hexamer). The UV signal at 280nm is plotted as an overlay. The molar masses were calculated using DRI and LS.
Further addition of zinc (to 0.3 mM) completely shifts the equilibrium towards the hexamer as seen in Sample 3 (Figure 4). In addition, the results showed the presence of another molecular species identified as the dodecamer of the insulin molecule in Sample 3. Although present in trace amounts, this peak produced a distinct signal readily observed by the LS detector.
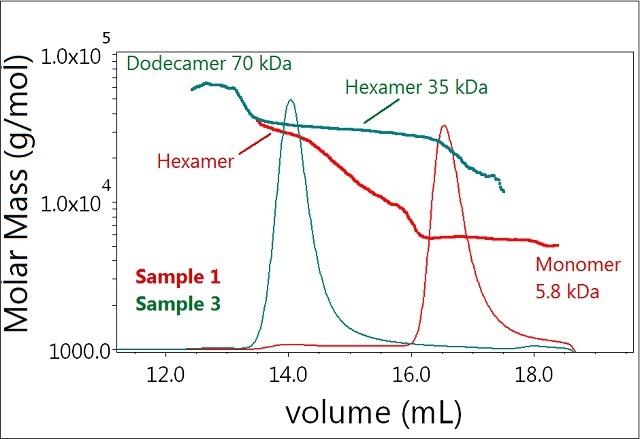
Figure 4. Plot of molar mass vs. time of sample 1 and 3. The UV signal at 280nm is plotted as an overlay. The molar masses were calculated using DRI and LS.
SEC-MALS allows the semi-quantitative estimation of the strength of a reversible self-association. Increasing the volume injected on the column increases the overall protein concentration as it passes through the detectors, thus shifting the equilibrium of the eluent toward the oligomeric complexes. For Samples 2 and 3, changes in equilibrium association were investigated by injecting either 50 µL or 200 μL of the same sample solution onto the SEC column.
The increased injection volume clearly affects the equilibrium of Sample 2 (Figure 5). As a higher insulin concentration is achieved, the monomer-dimer equilibrium is shifted towards dimer and higher order oligomers. The lowest measured molar mass observed for the 50 μL injection is ~6 kDa, corresponding to the monomer. However, the smallest measured molar mass for the 200 µL injection has a molar mass consistent with a dimer. The hexamer fraction is unaffected by the increase in eluting concentration and shows no tendency to form larger oligomers.
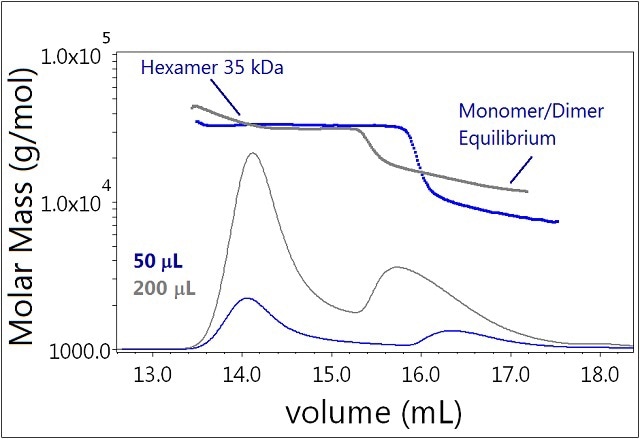
Figure 5. Plot of molar mass vs. time of sample 3. The DRI signal is plotted as an overlay. The UV signal is saturated due the high sample load. The molar masses were calculated using DRI and LS data.
In the case of Sample 3, there is basically no effect of varying the injection volume (Figure 6). In the presence of 0.3mM zinc, the system is "locked" in its hexamer form and identical molar masses are determined at both concentrations (50 and 200μL injected). There is also no increase in the mass fraction of dodecamer. Clearly the self-association behavior of the hexamer is greatly different from that of the monomer.
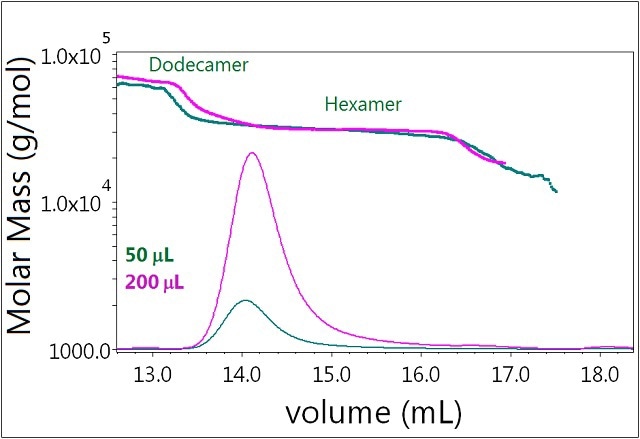
Figure 6. Plot of molar mass vs. time of sample 3. The DRI signal is plotted as an overlay. The UV signal is saturated due the high sample load. The molar masses were calculated using DRI and LS data.
Conclusion
The results clearly show the ability of SEC-MALS to analyze association phenomena not only for large proteins like antibodies, but also for peptide molecules with lower molecular masses. Since the use of proteins and peptides for therapeutic purposes is continually increasing, the application of light scattering as a powerful method of molecular characterization will also become more and more important.
References
Adapted from "Identification of Insulin Oligomeric States using SEC-MALS” white paper by P.Wahlund, D. Roessner and T. Jocks. Graphs and illustrations reprinted with permission from Wyatt Technology.
1. M. H. Jensen, P.-O. Wahlund, J. K. Jacobsen, B. Vestergaard, M. van de Weert, S. Havelund., (2011). Self-association of long-acting insulin analogues studied by size exclusion chromatography coupled to multi-angle light scattering. Journal of Chromatography B, 879(28), 2945-2951.
2. Jonassen, S. Havelund, T. Hoeg-Jensen, D. B. Steensgaard, P.-O. Wahlund, U. Ribel., (2012). Design of the Novel Protraction Mechanism of Insulin Degludec, an Ultra-long-Acting Basal Insulin. Pharmaceutical Research, 29(8), 2104-2114.
3. Arun K. Attri, Cristina Fernández, Allen P. Minton., (2010). pH-dependent self-association of zinc-free insulin characterized by concentration-gradient static light scattering. Biophys. Chem., Vol. 148, 28-33.
4. Arun K. Attri, Cristina Fernández, Allen P. Minton., (2010) Self-association of Zn-insulin at neutral pH: Investigation by concentration gradient-static and dynamic light scattering. Biophysical J., Vol. 148, 23-27.
5. Quantifying Self-Association of Insulin at Neutral pH Using Composition-gradient Multi-angle Light Scattering Technology.

This information has been sourced, reviewed and adapted from materials provided by Wyatt Technology.
For more information on this source, please visit Wyatt Technology.