Fermentation is a metabolic process by which products are altered by microorganisms. It can be used for preserving or altering foods such as bread, vinegar, yoghurt or wine. Fermentation may take place naturally such as milk turning sour or it can be controlled by the addition of specific micro-organisms. Producing wine or cheese are examples of controlled fermentation. It is required that the fermentation be monitored in an industrial scenario as fermentation that is not controlled, can destroy complete batches of a product.
This article describes how the Spinsolve benchtop NMR spectrometer can be used for controlling sugar conversion to ethanol be the process of fermentation in the absence of sample processing. The various outcomes of uncontrolled and controlled fermentation are explained.
Fermentation Process
Fermentation takes place in a number of stages:
Firstly, sucrose divides into two glucose molecules
C12H22O11 + H2O → 2 C6H12O6
Secondly glucose gets converted to carbon dioxide and ethanol.
C6H12O6 → 2 C2H5OH + 2 CO2
The bubbles normally observed during fermentation are because of carbon dioxide being produced as a byproduct.
Finally, ethanol is converted into acetic acid, under the presence of oxygen, acetobacter and acetic acid bacteria.
C2H5OH + O2 → CH3COOH + H2O
Sample Preparation and Measurement
Two samples taken from fresh untreated apple juice was transferred to 3l plastic bottles and one sample was treated with brewer’s yeast for controlled fermentation.
The other sample was left untreated for wild fermentation and both bottles were maintained at room temperature.
Figure 1 shows an example spectrum of the wild fermentation sample.
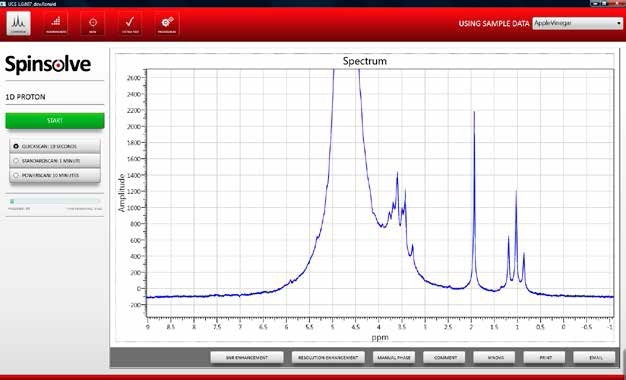
Figure 1. NMR spectrum apple juice after undergoing wild fermentation.
NMR Spectra of Fresh and Fermented Juice Samples
The NMR spectra of the fresh juice and the completely fermented samples are observed in Figure 2. A large peak of 4.7ppm is observed in all the sample spectra due to the water.
Several small peaks are seen in a vertical expansion between 1 and 4ppm. In Figure 2, these peaks are assigned.
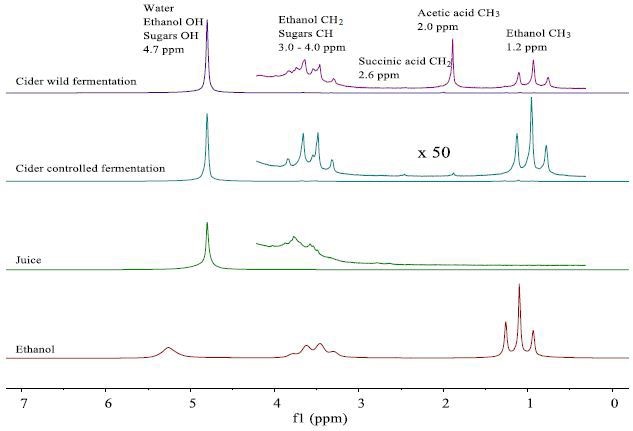
Figure 2. NMR spectra of fresh apple juice and apple cider from wild and controlled fermentation after 20 days. The juice and cider spectra are dominated by the prominent water peak, but the vertical expansion by a factor 550 reveals the presence of smaller peaks, which can be assigned. In order to aid peak assignment, for spectrum of a 99% ethanol/water mixture is also shown.
Measurement of Alcohol Content and Conversion Rate
It is observed that the H3 peaks at 1.2 and 2.0ppm are resolved and can be integrated for a quantitative measurement of ethanol and acetic acid content.
Figure 3 shows a plot of the measured volume concentrations. The absence of secondary fermentation and the high conversion rate is evident in controlled fermentation.
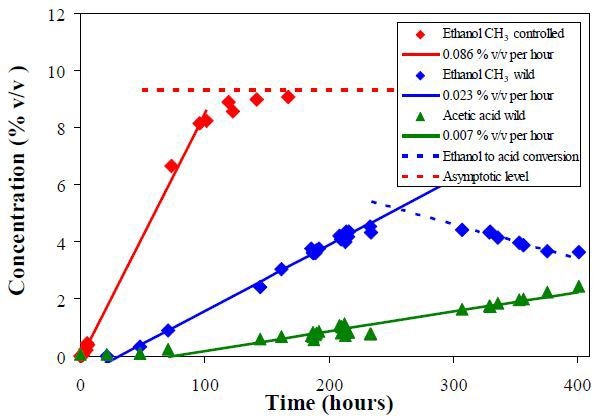
Figure 3. Volume concentrations of ethanol and acetic acid obtained from the CH3 peak integral of the NMR spectra. The lines show the regression of the data points in the linear region.
Conclusion
The fermentation process of untreated apple juice was monitored using the Spinsolve benchtop NMR spectrometer. There was a clear difference seen between controlled and wild fermentation. The samples were taken from the fermentation vessel without any processing or purification. Hence the Spinsolve benchtop NMR spectrometer can be used as an on-line process monitoring tool.

This information has been sourced, reviewed and adapted from materials provided by Magritek.
For more information on this source, please visit Magritek.